The Advanced Map is a crucial tool for Readymix Mas, allowing the detailed tracking of all deliveries, the visualization of areas of greatest activity through a "Heat Map" and the precise monitoring of the trips made through the "Tracking History". This solution offers valuable insights to optimize routes, reduce delivery times and improve logistics efficiency, resulting in more efficient management and informed strategic decision-making.
Open the menu on the left side of the screen and select "Advanced Map".
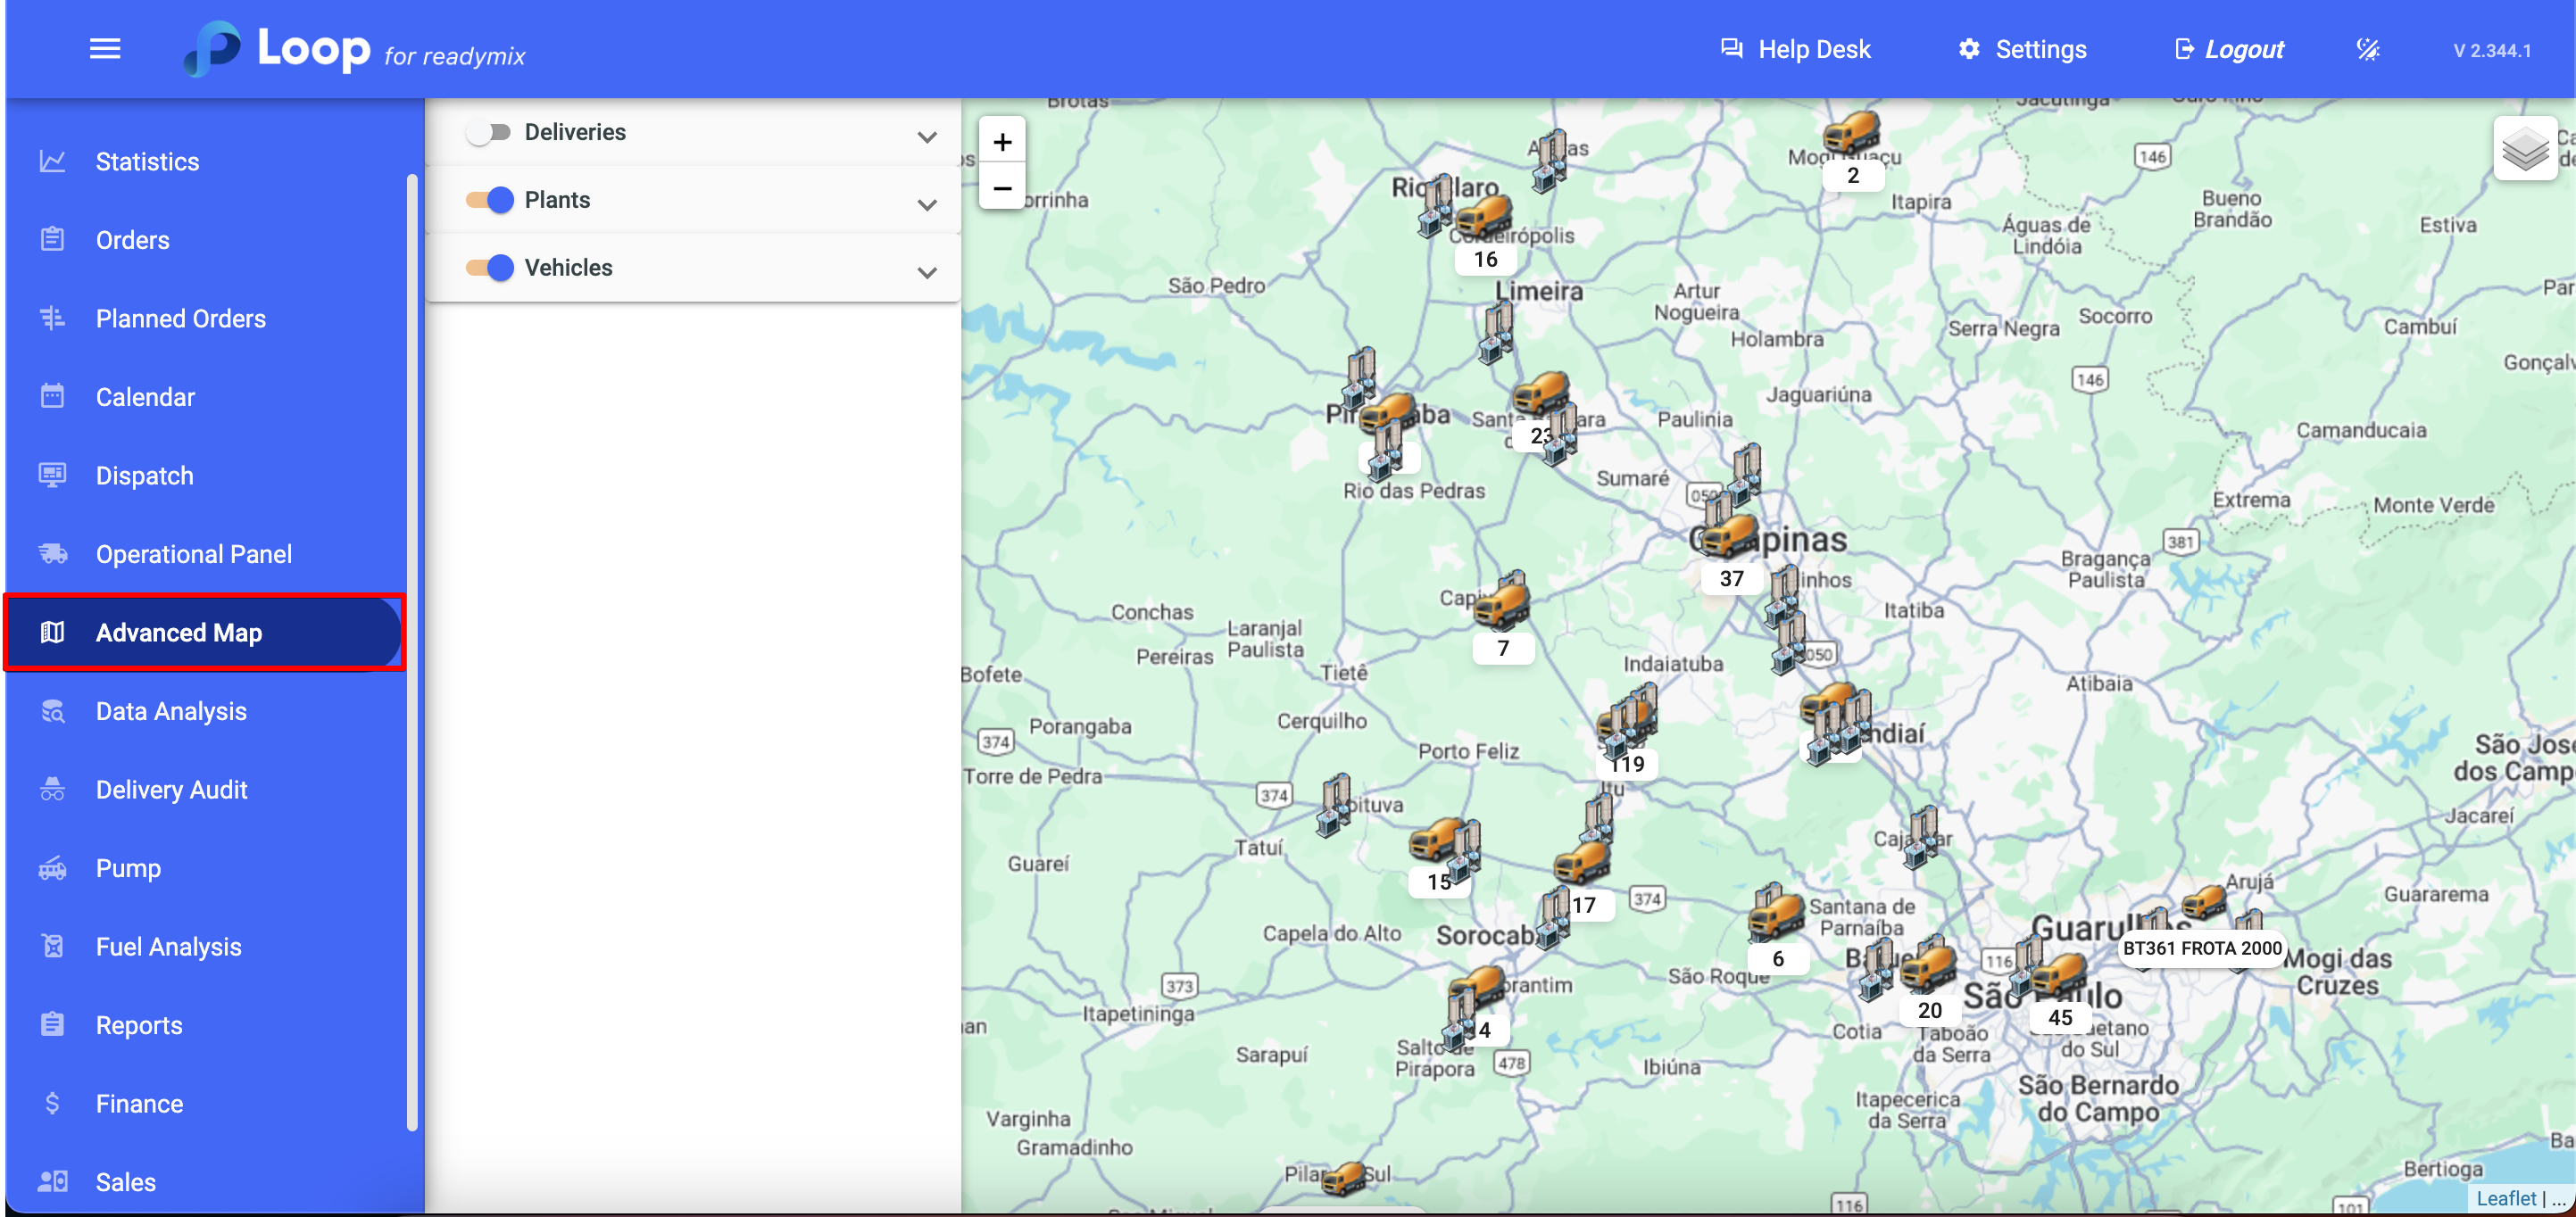
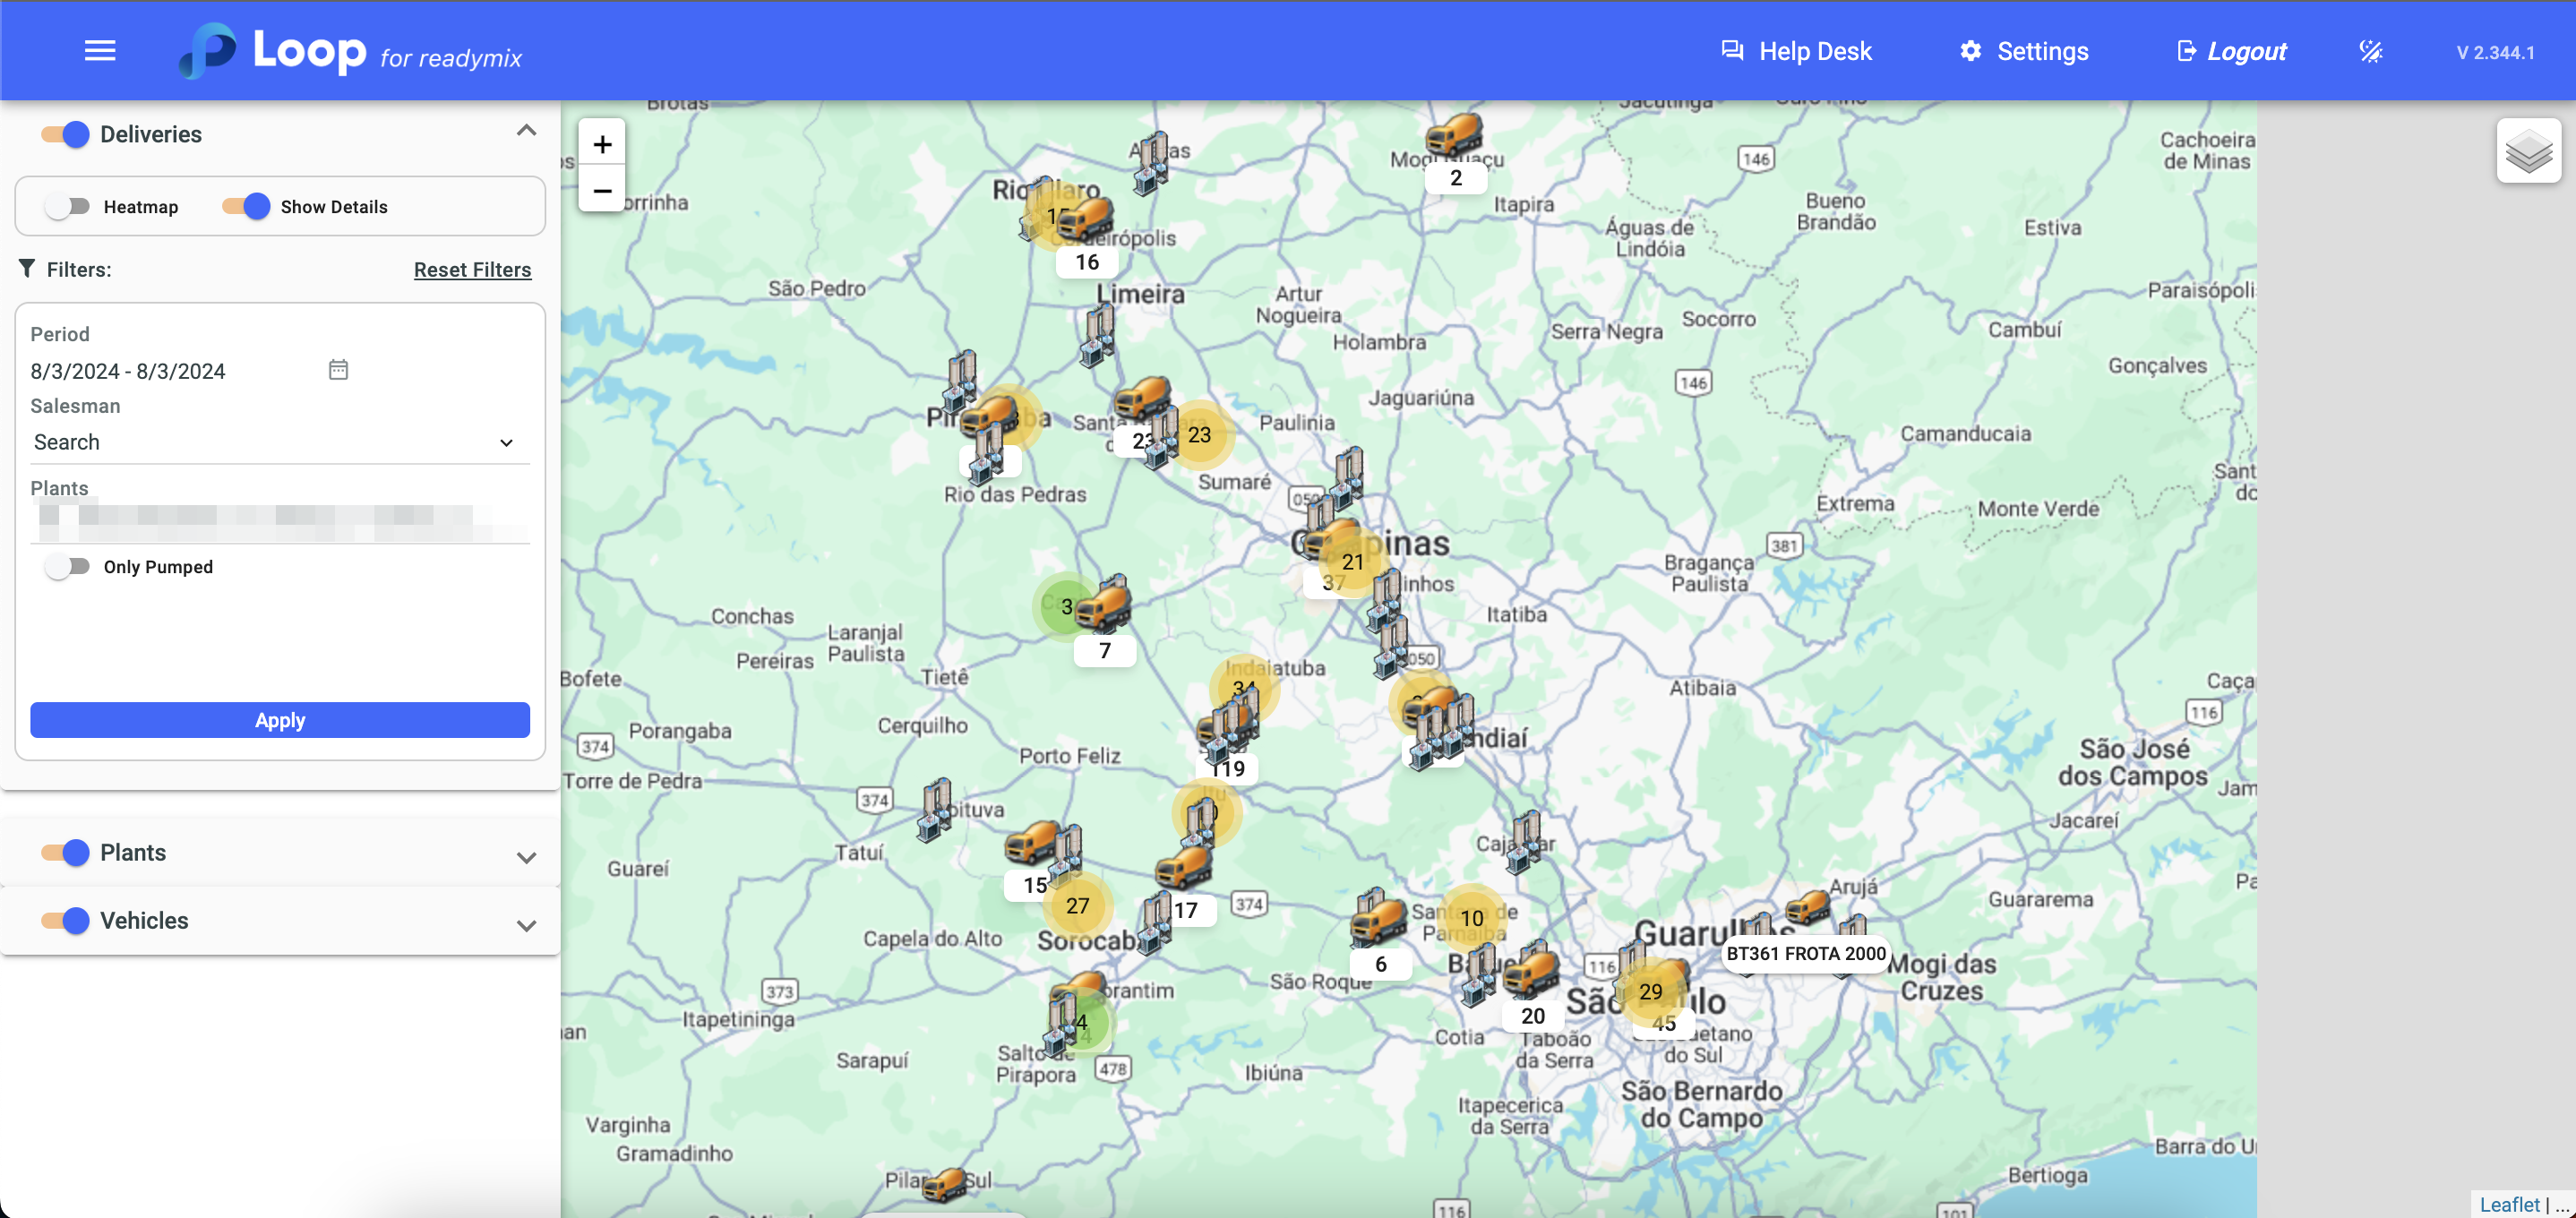
By selecting the "Deliveries" option, you can view all deliveries on the map according to their respective regions.
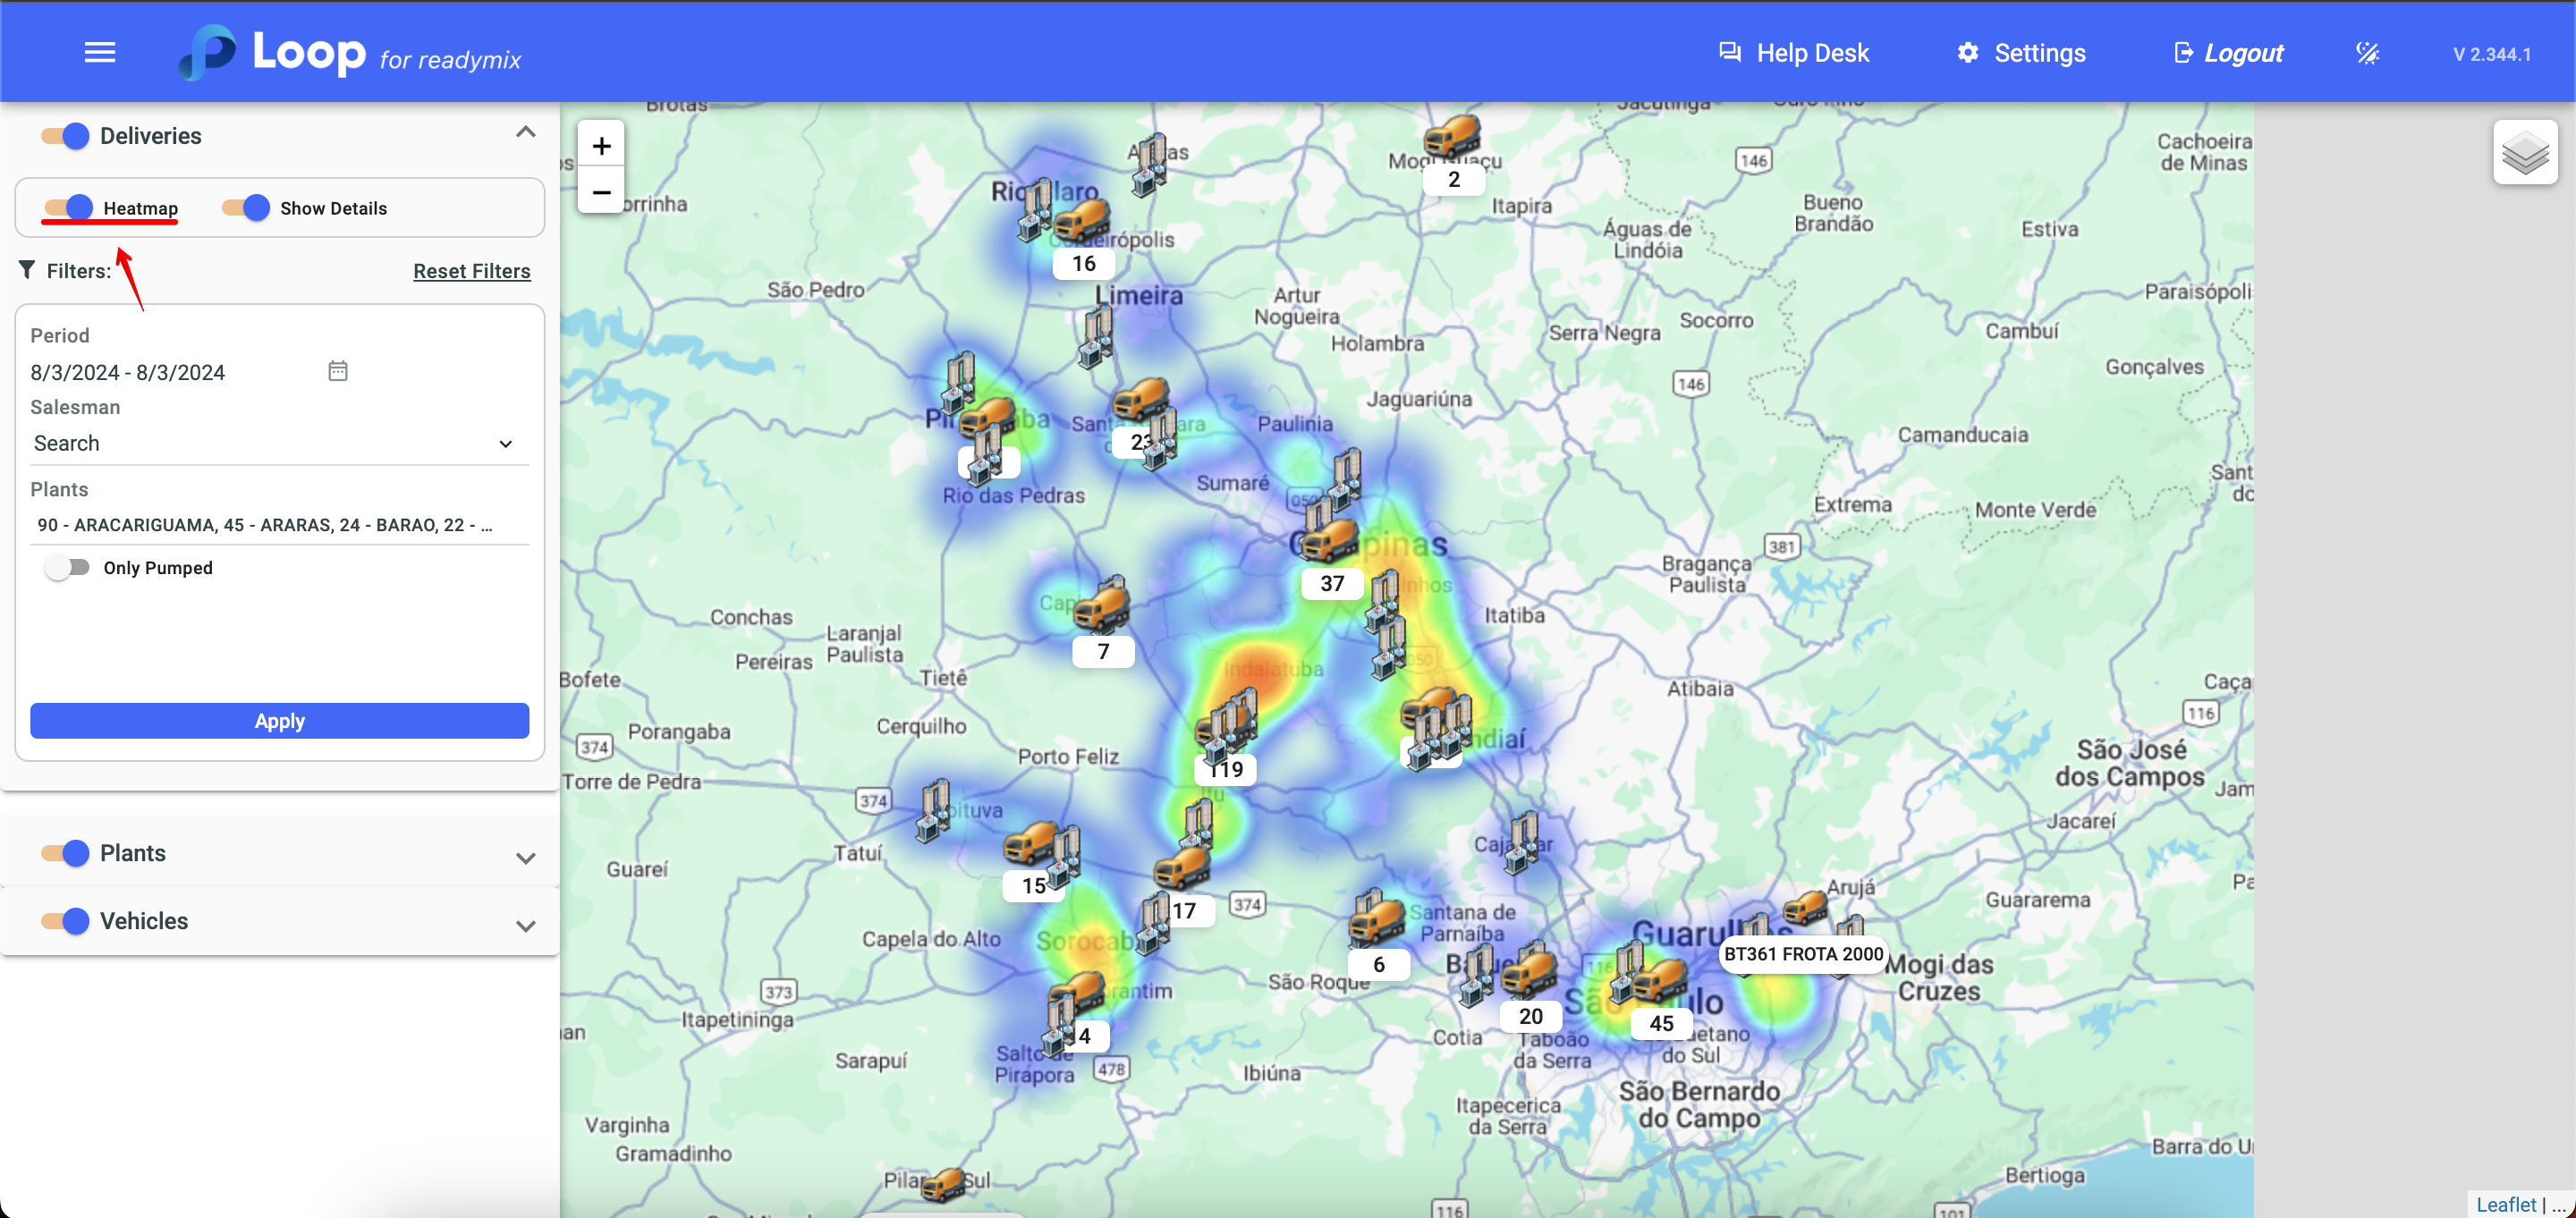
An alternative is to use a heat map that can be activated to visually represent the quantities of deliveries, correlated with different color shades based on temperature levels.
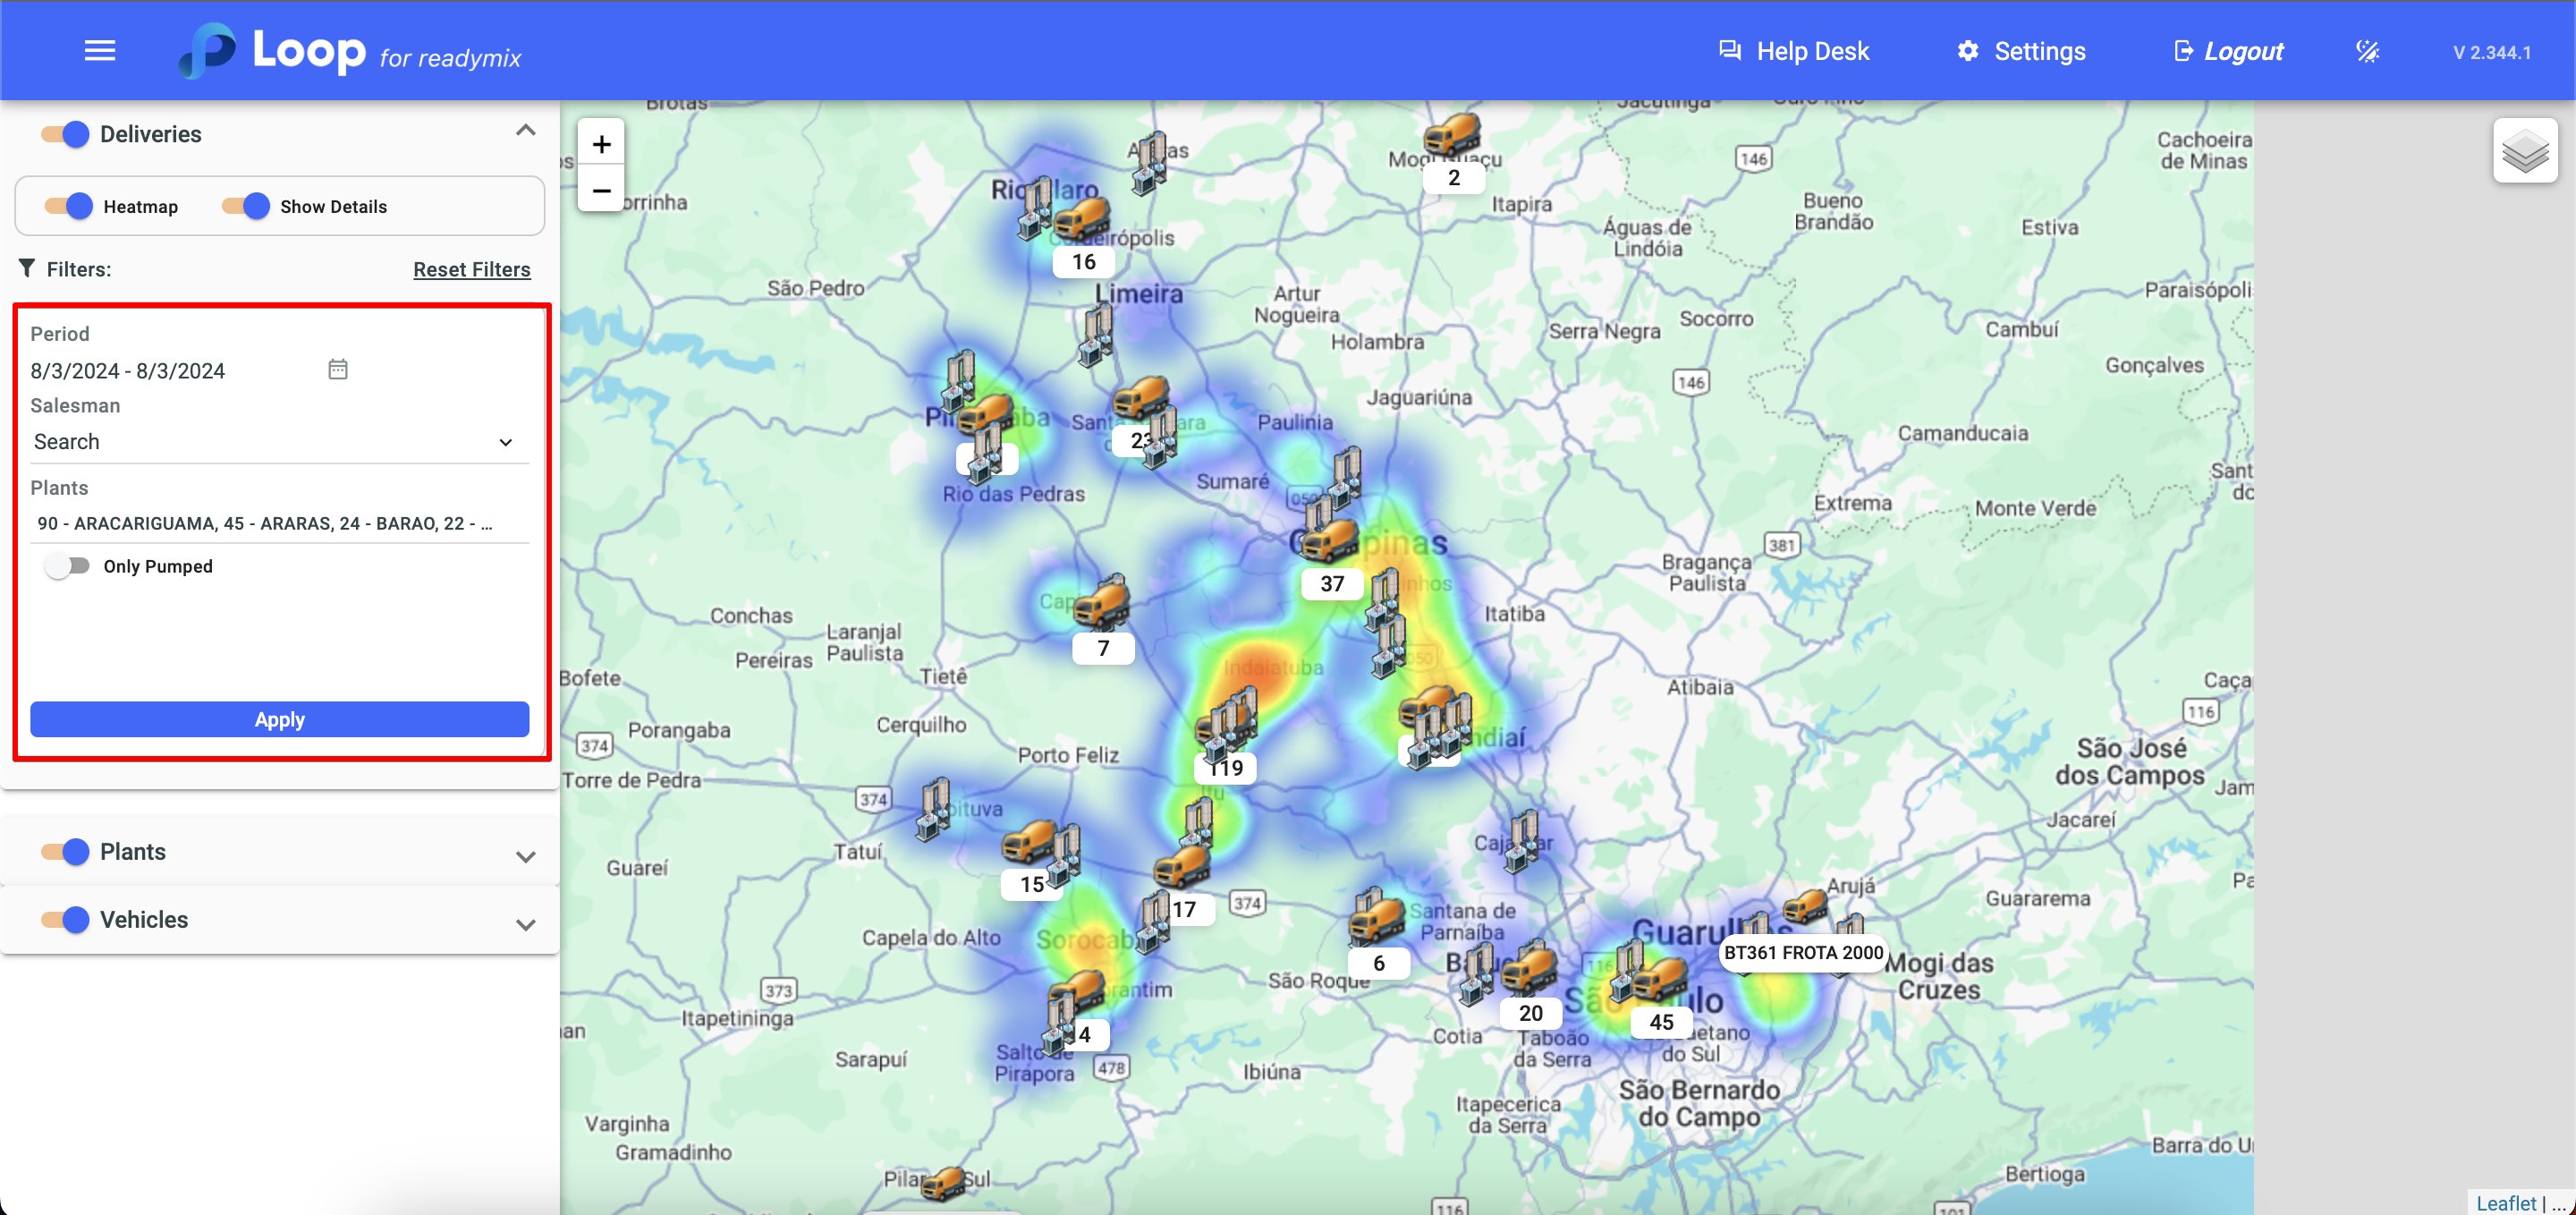
You can also use filters to refine your search.
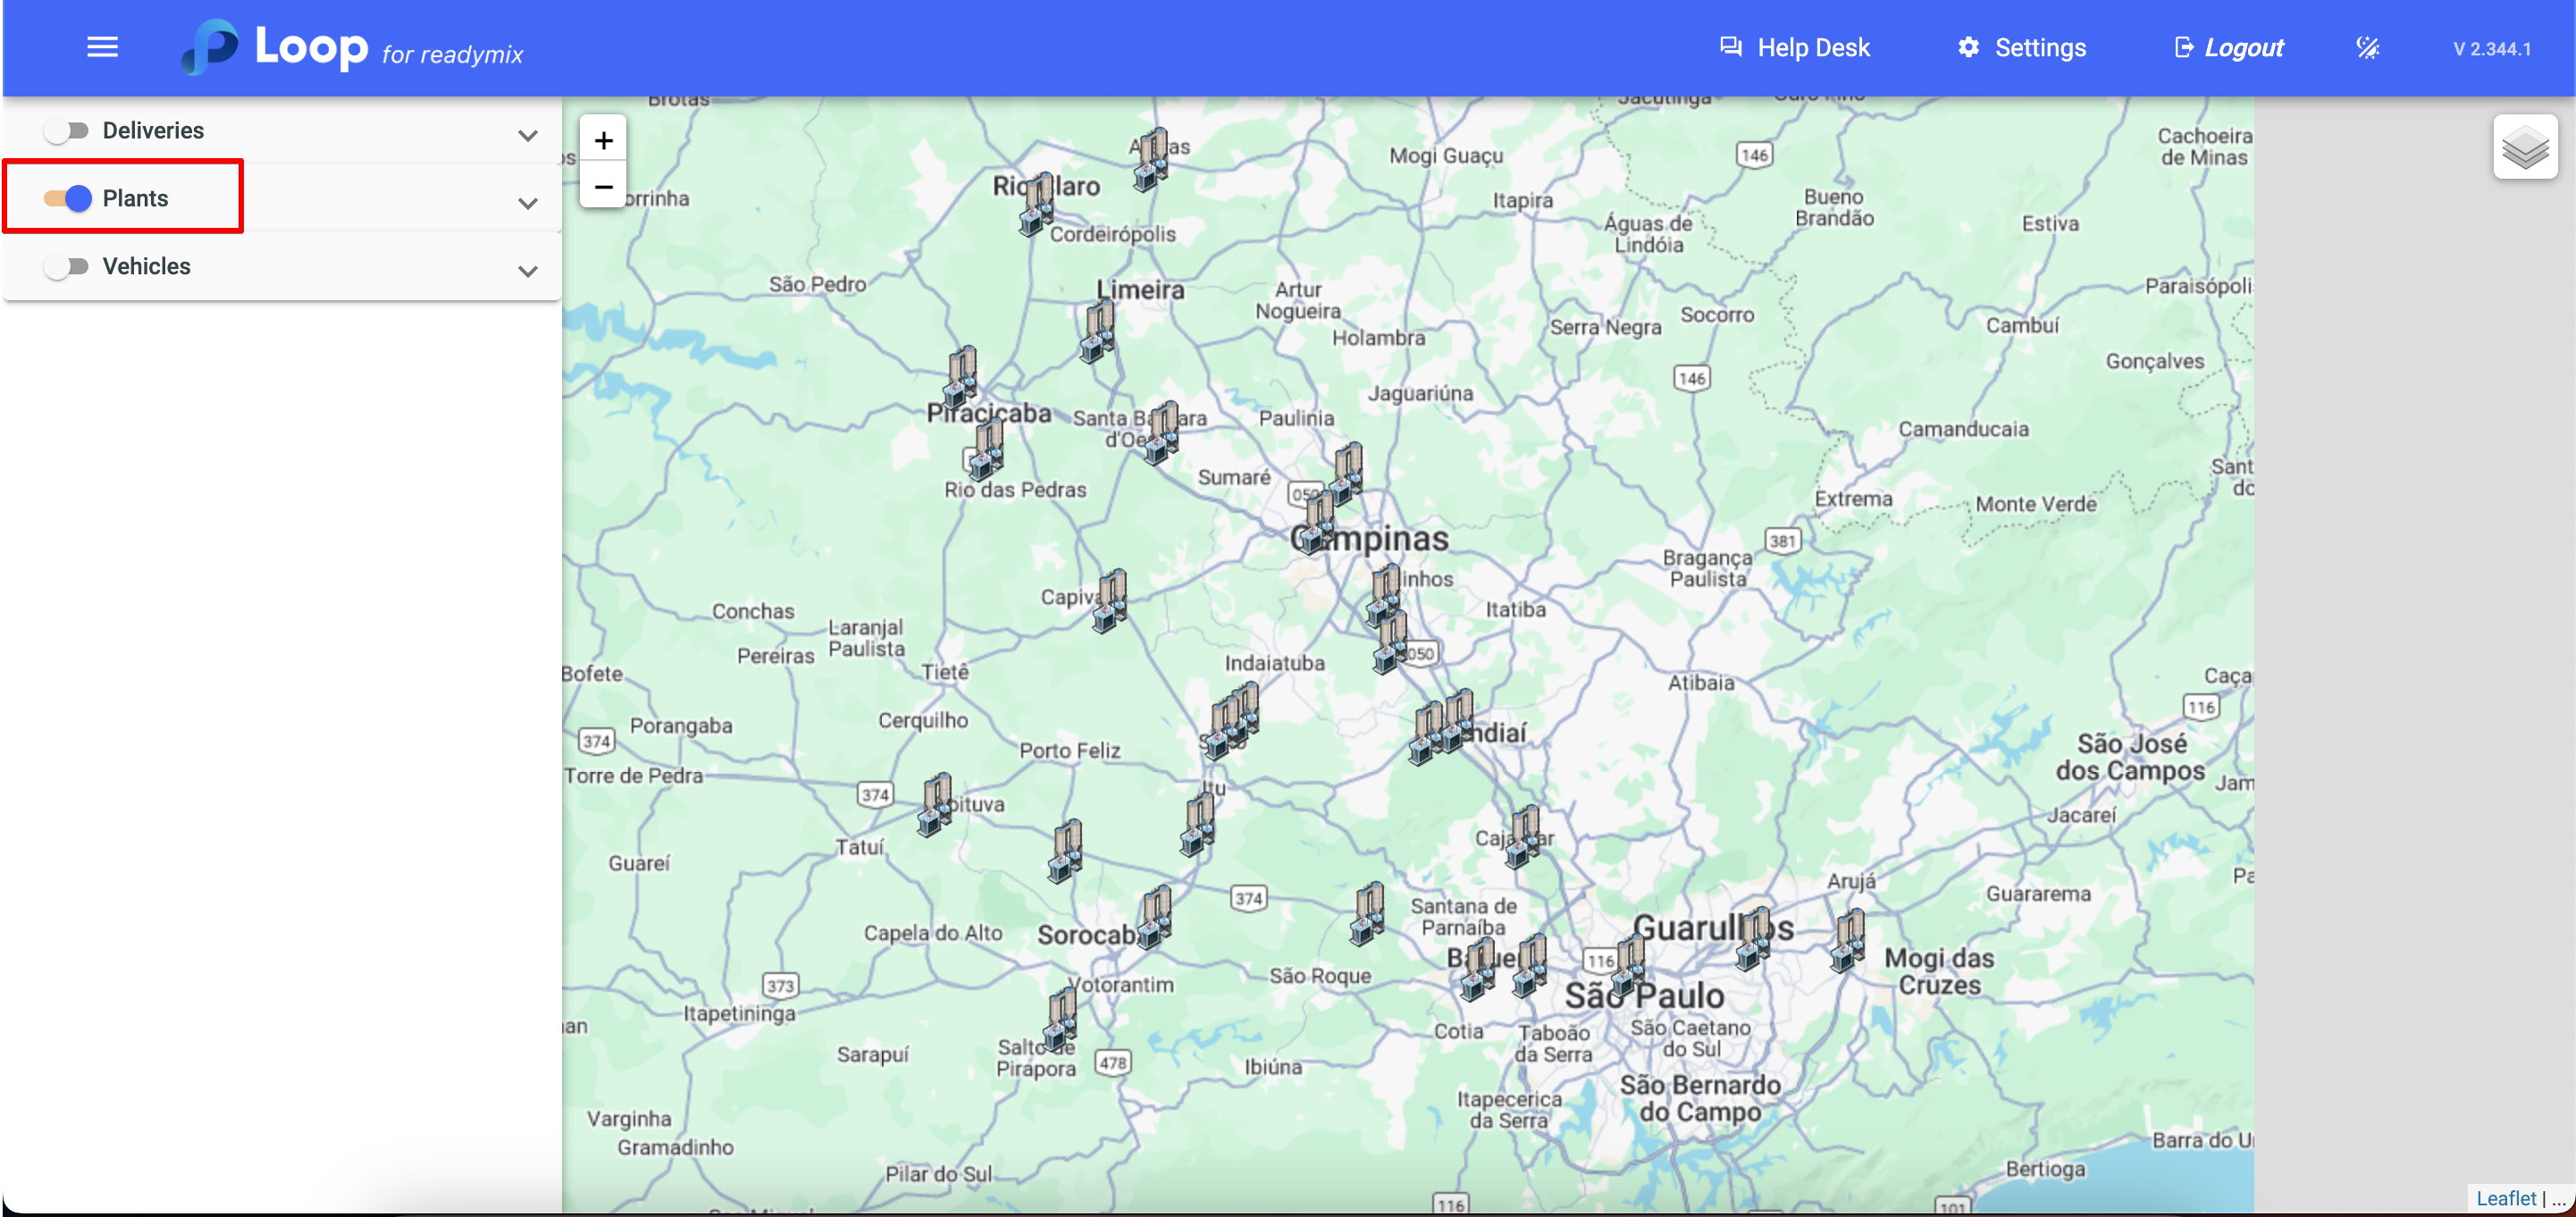
Selecting the "Plants" option allows you to view only the plants on the advanced map
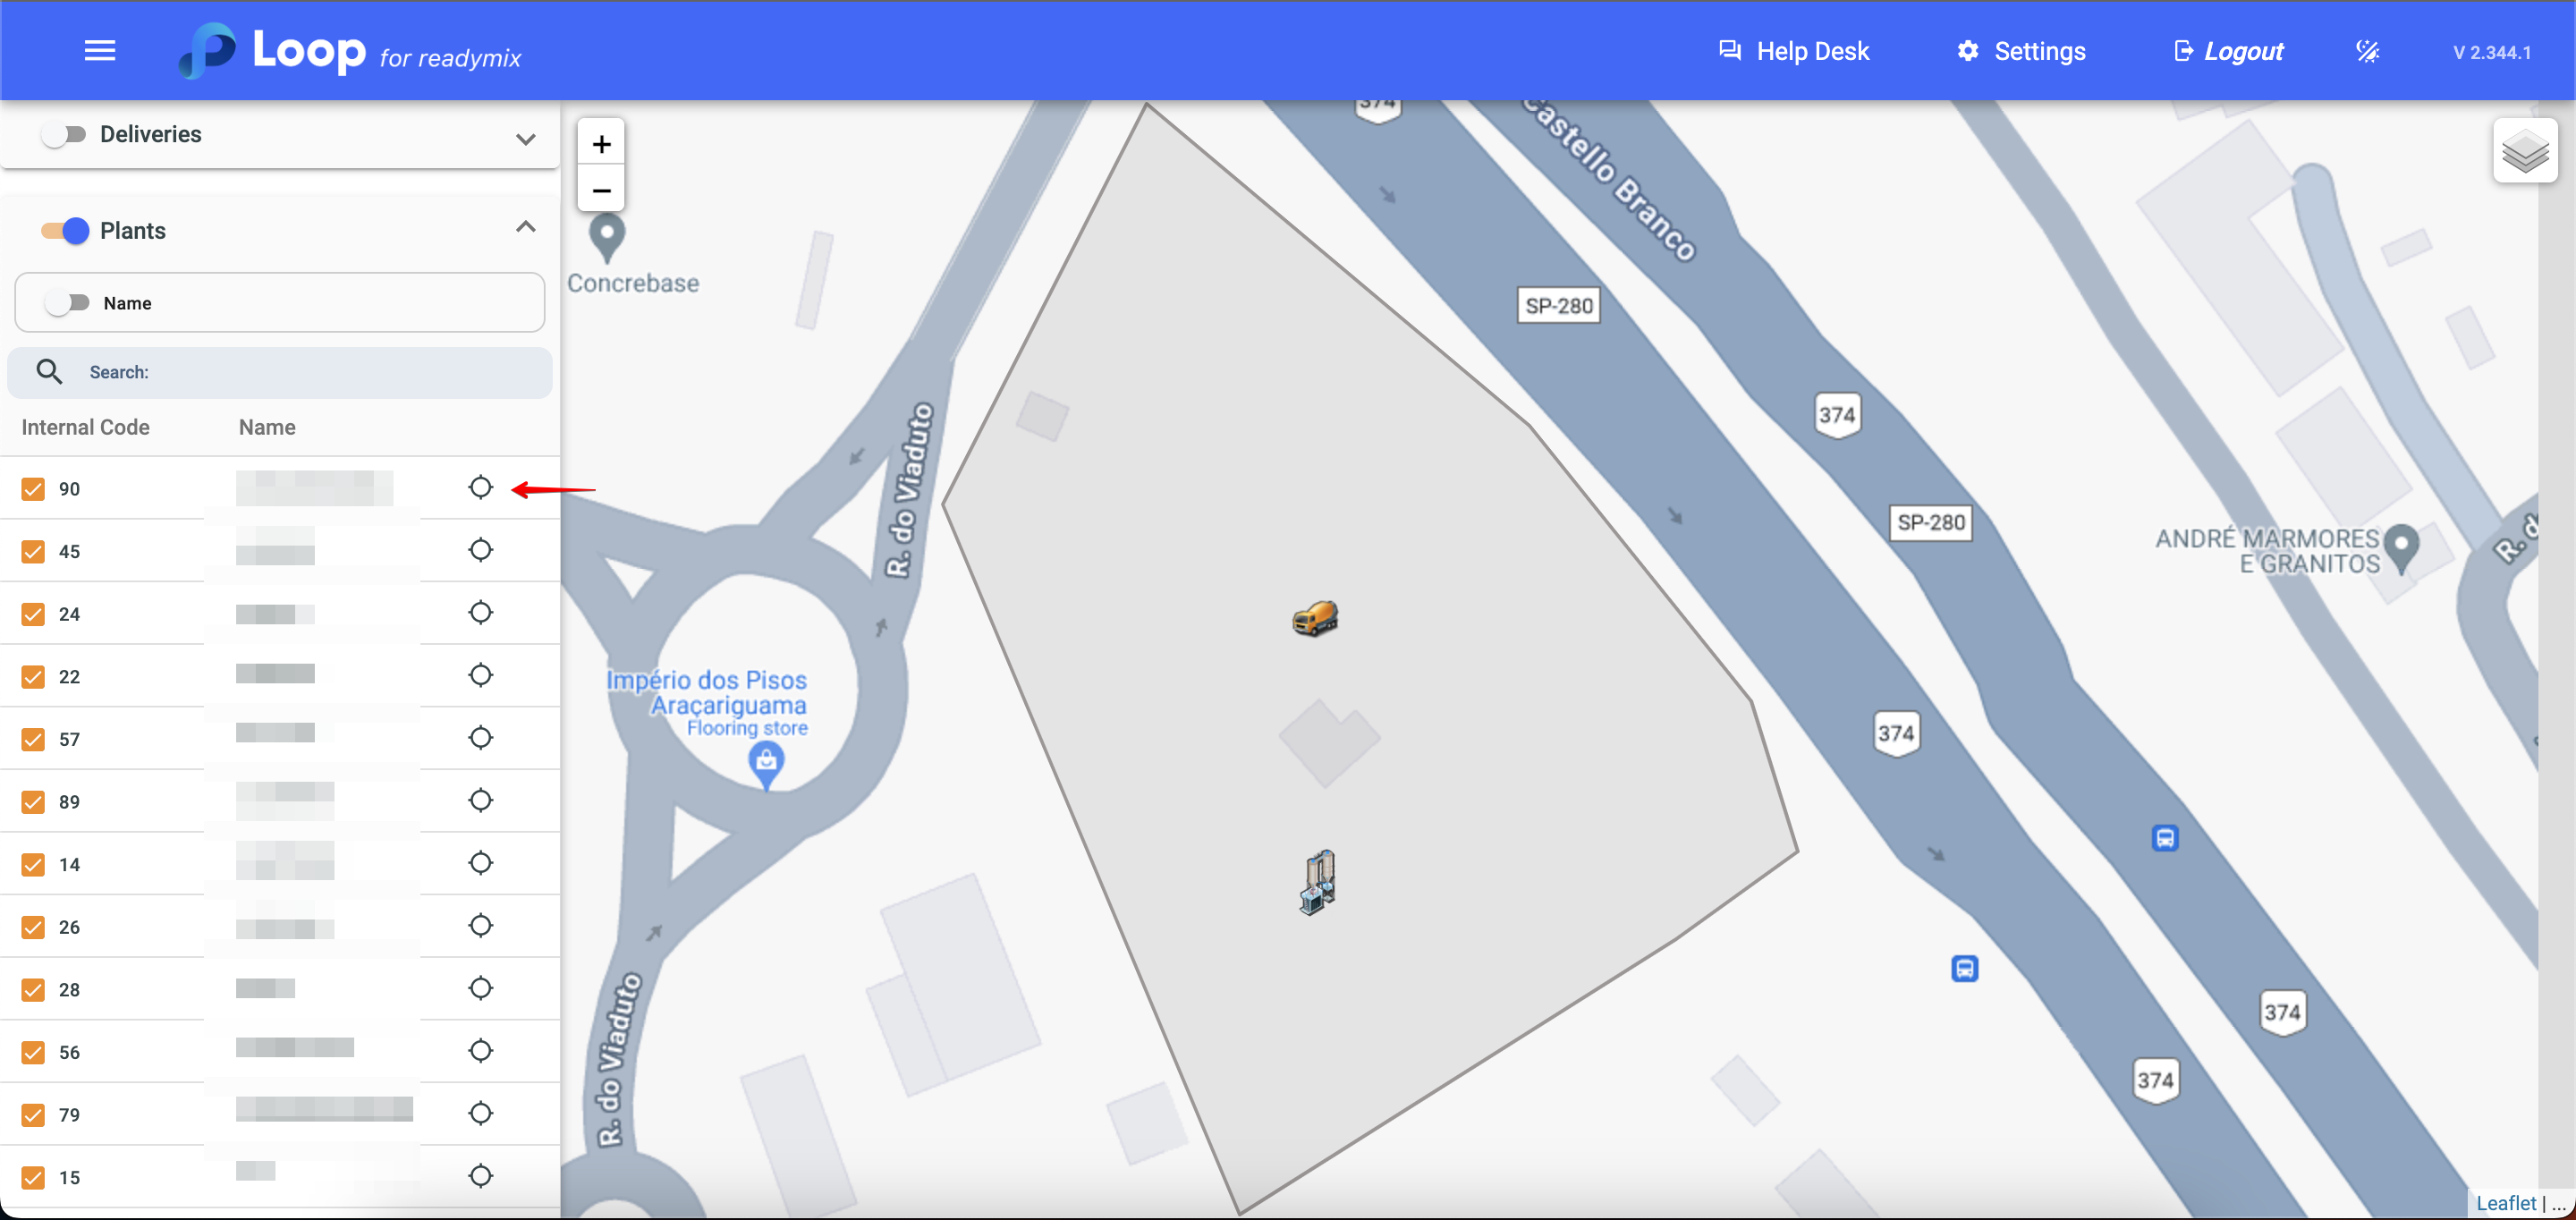
You can also zoom in on a specific plant by clicking on the location icon.
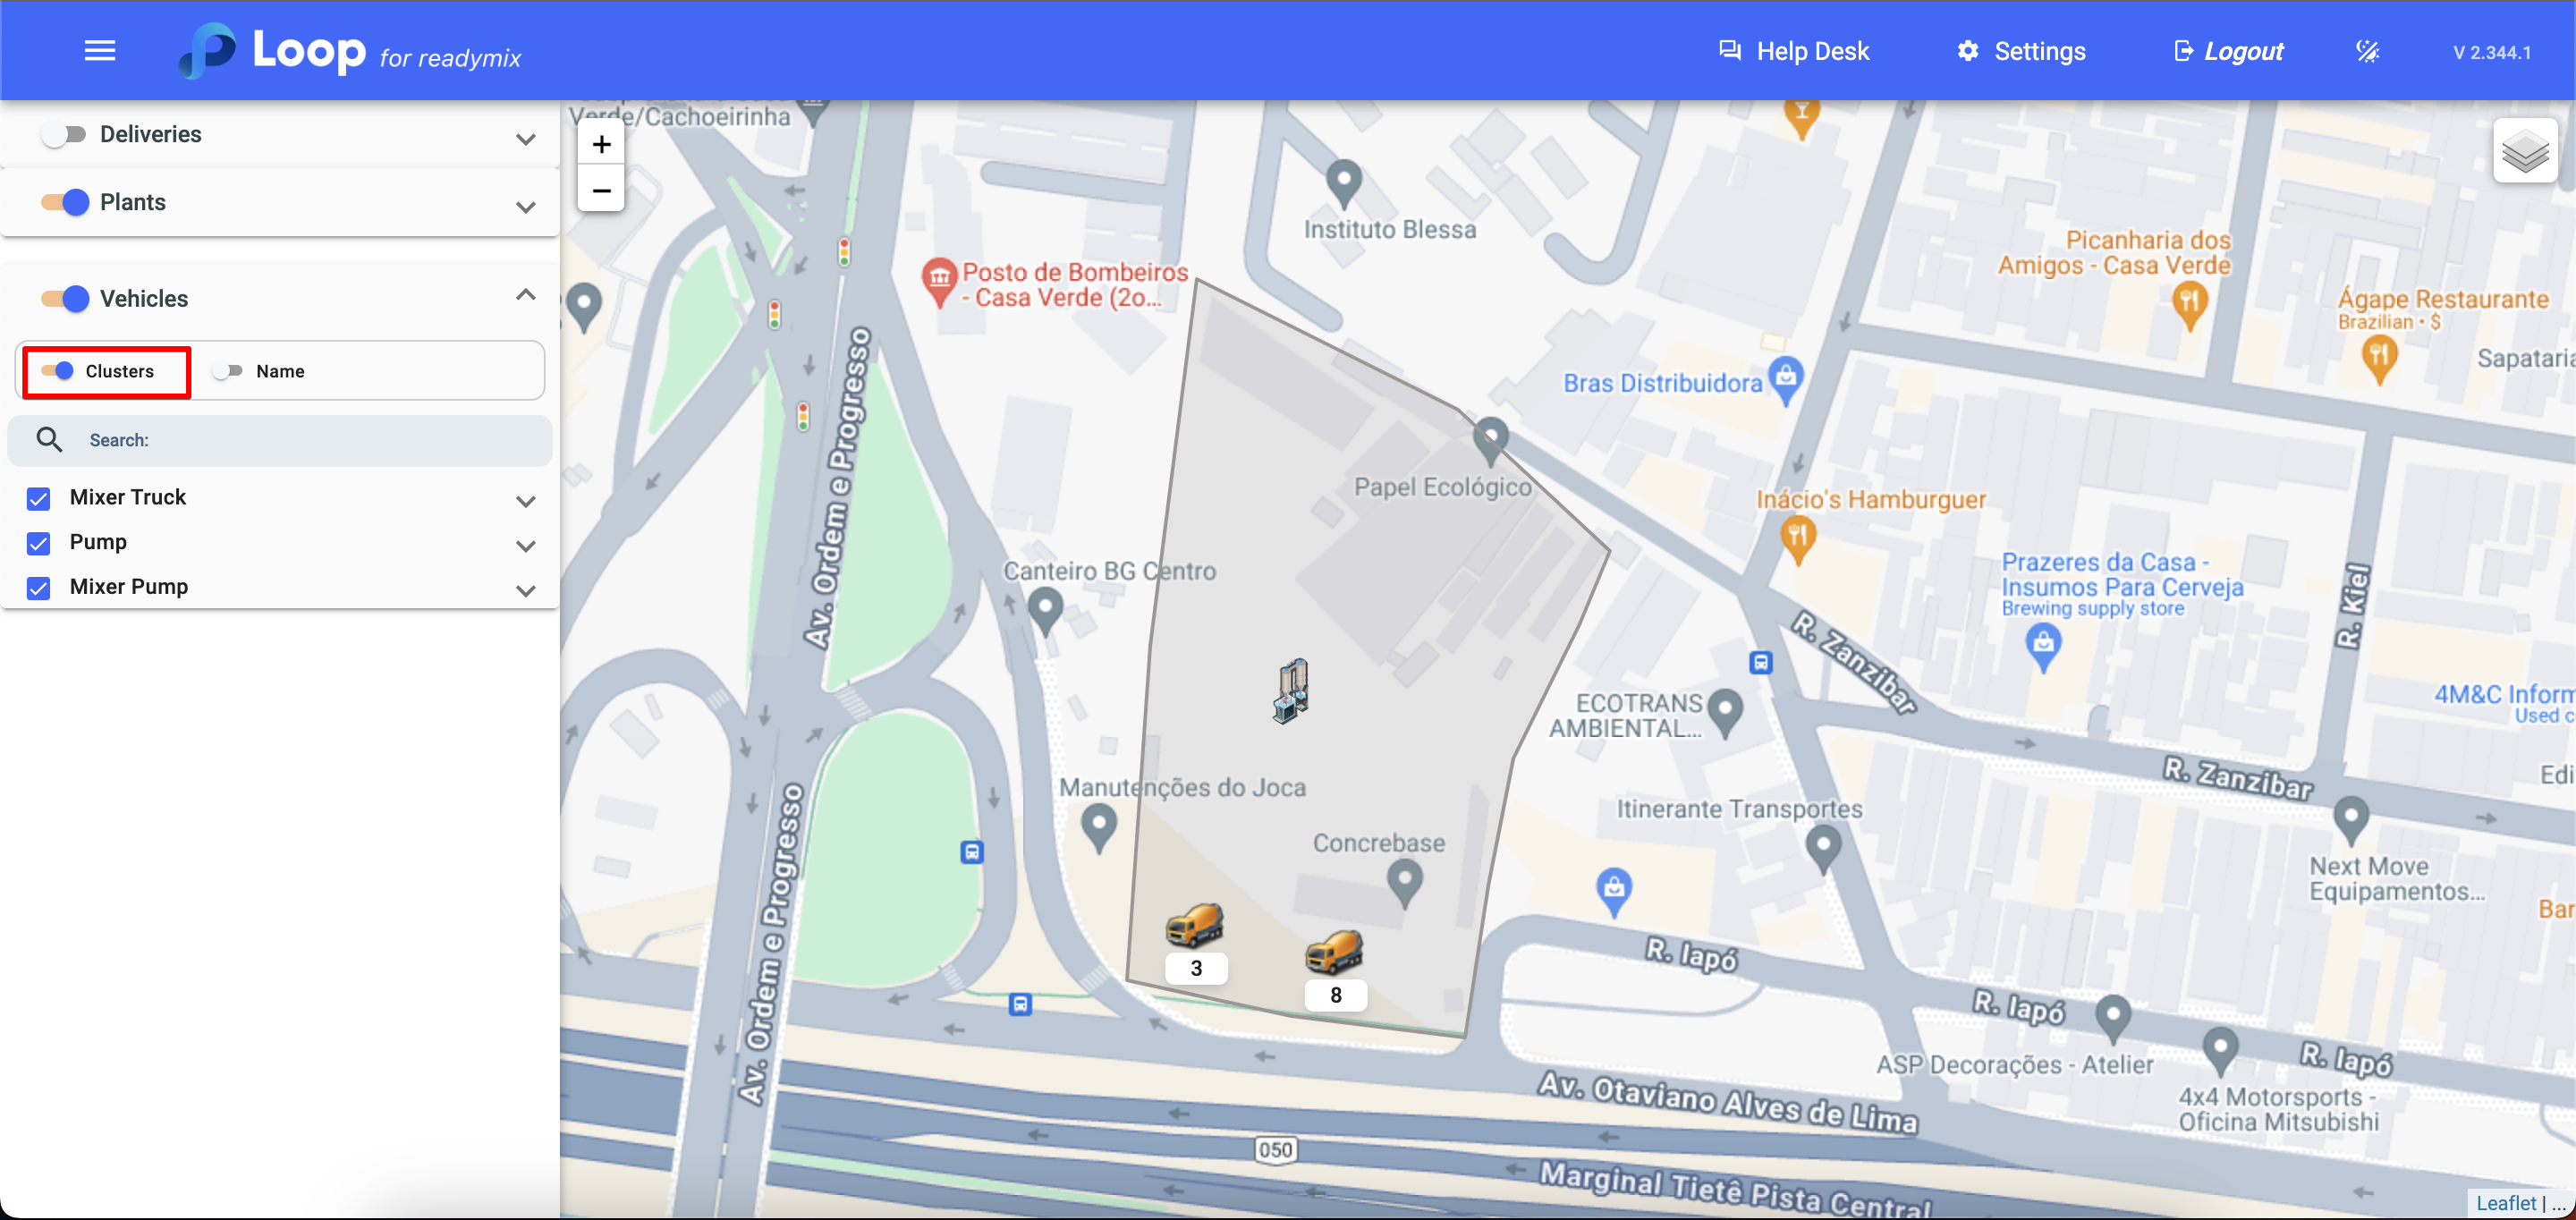
If needed, you can simplify the view on the vehicle map by replacing individual icons with numbers indicating the quantity of vehicles in a specific area. This provides a clearer and more organized view.
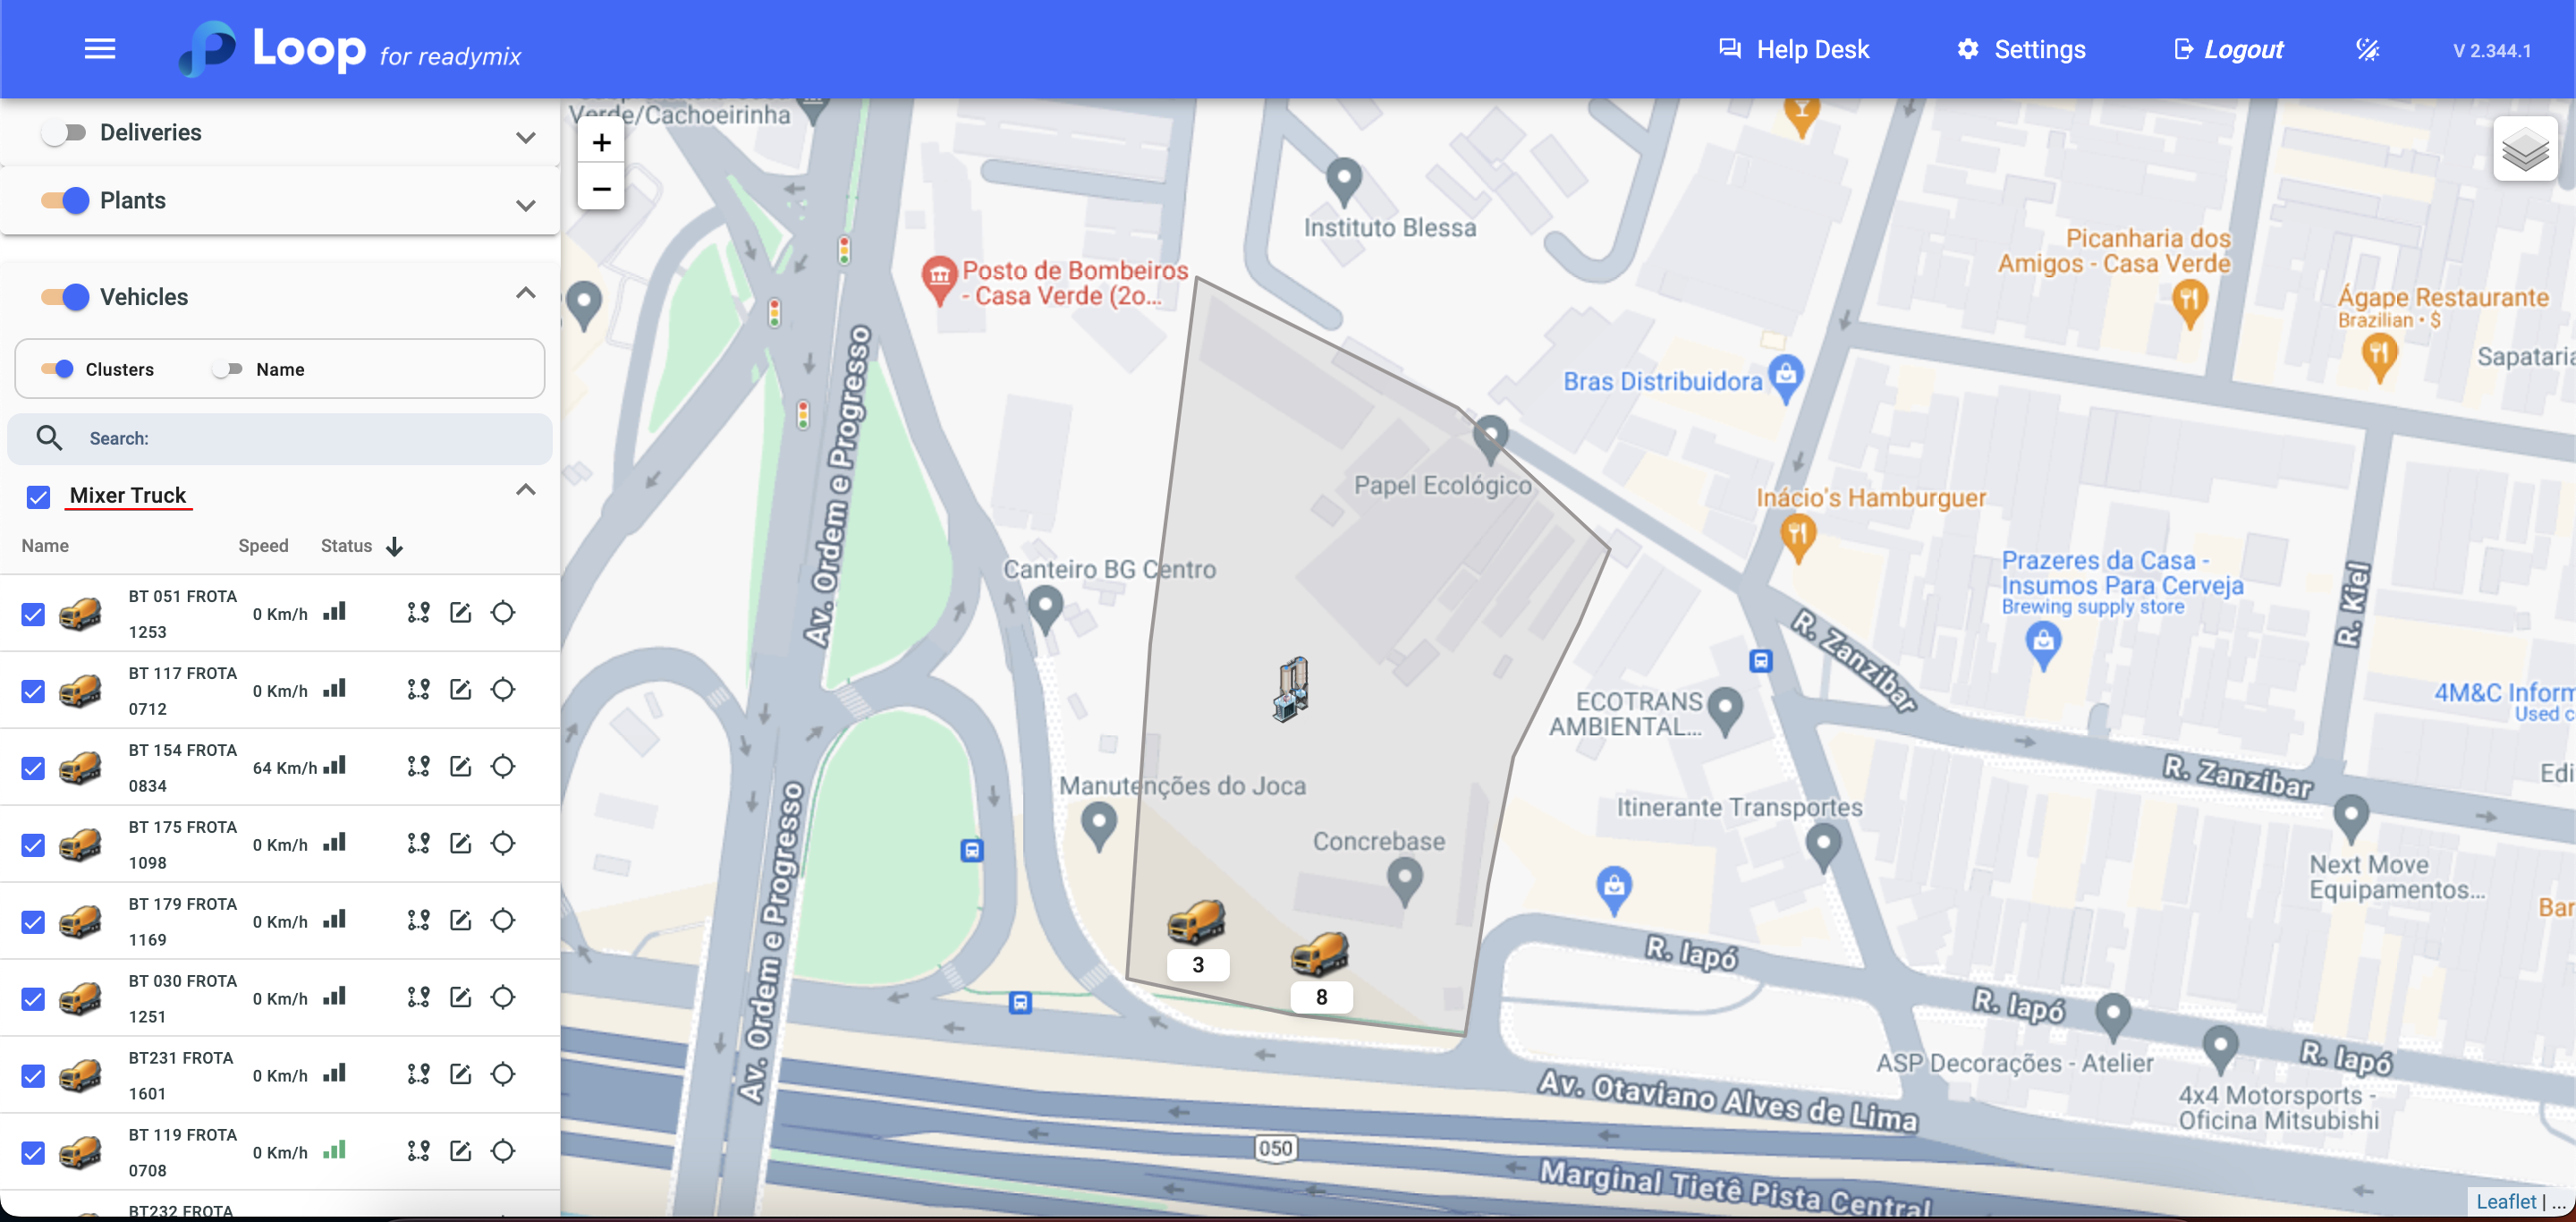
By clicking on the arrow next to the vehicles, you can get a summary view of all vehicles on the map, along with additional information such as the last time the GPS system sent data to the Loop system.
Clicking on "Tracking History" allows you to view previous routes taken by the vehicle and track them, allowing you to choose the desired date for tracking.
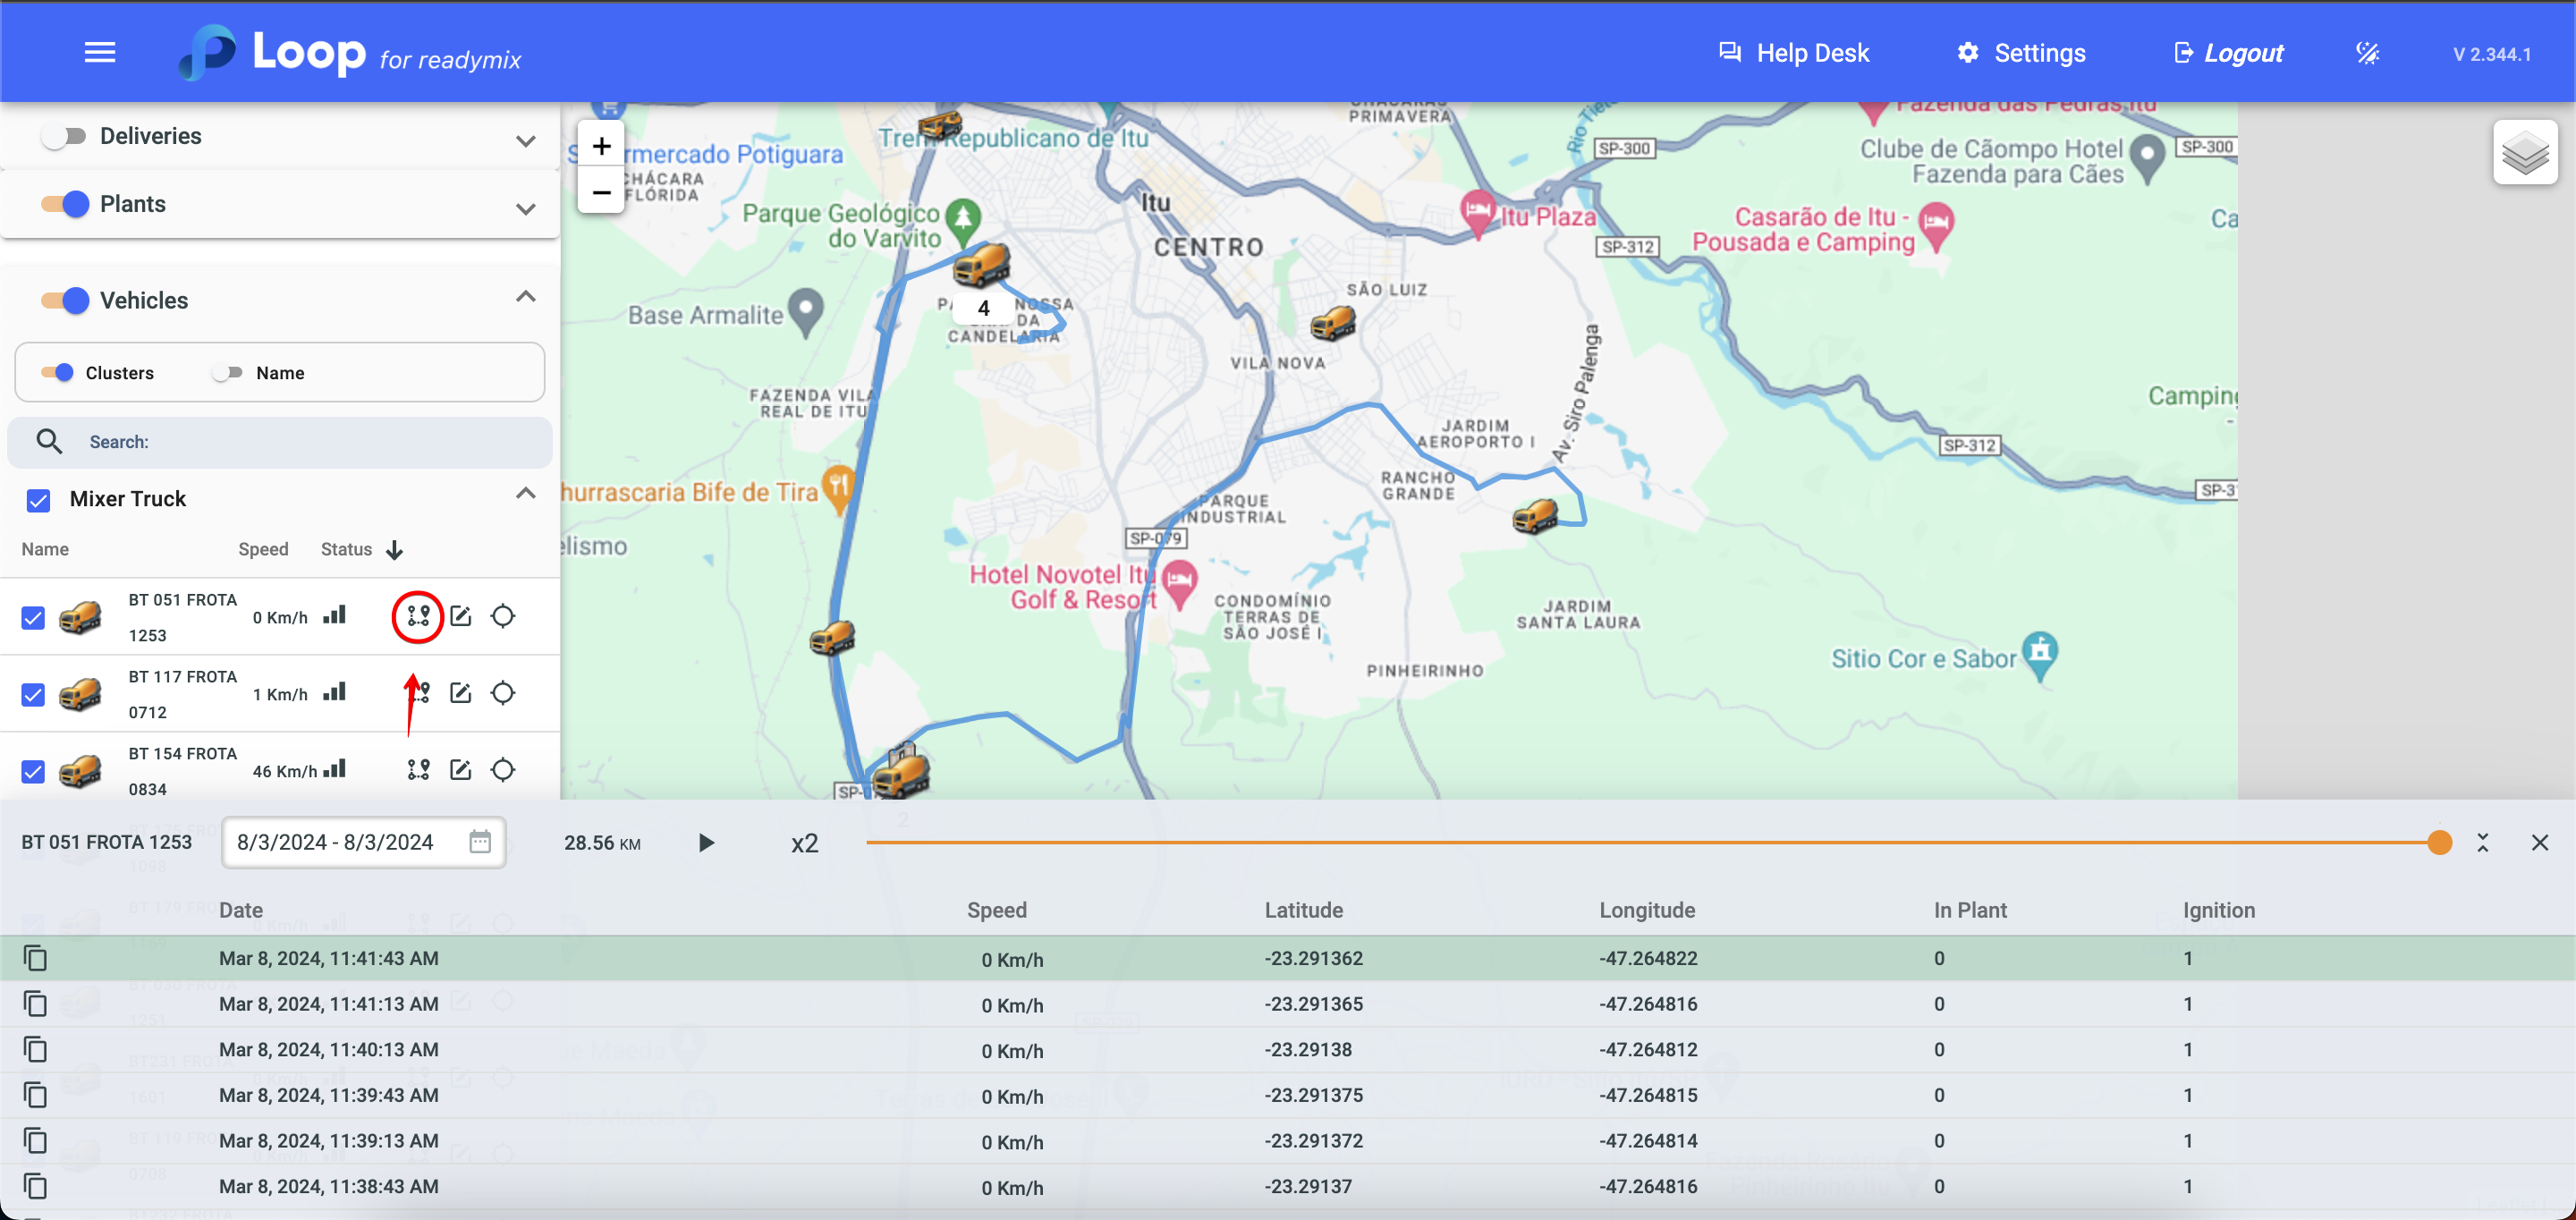
Simulation of a tracking history: