The CUSUM chart (Cumulative Sum Control Chart) is a statistical tool used to monitor and detect changes in concrete production processes over time. It is based on the accumulated sum of the differences between the observed values and a reference (usually the average expected or objective value) and is often used in quality control.
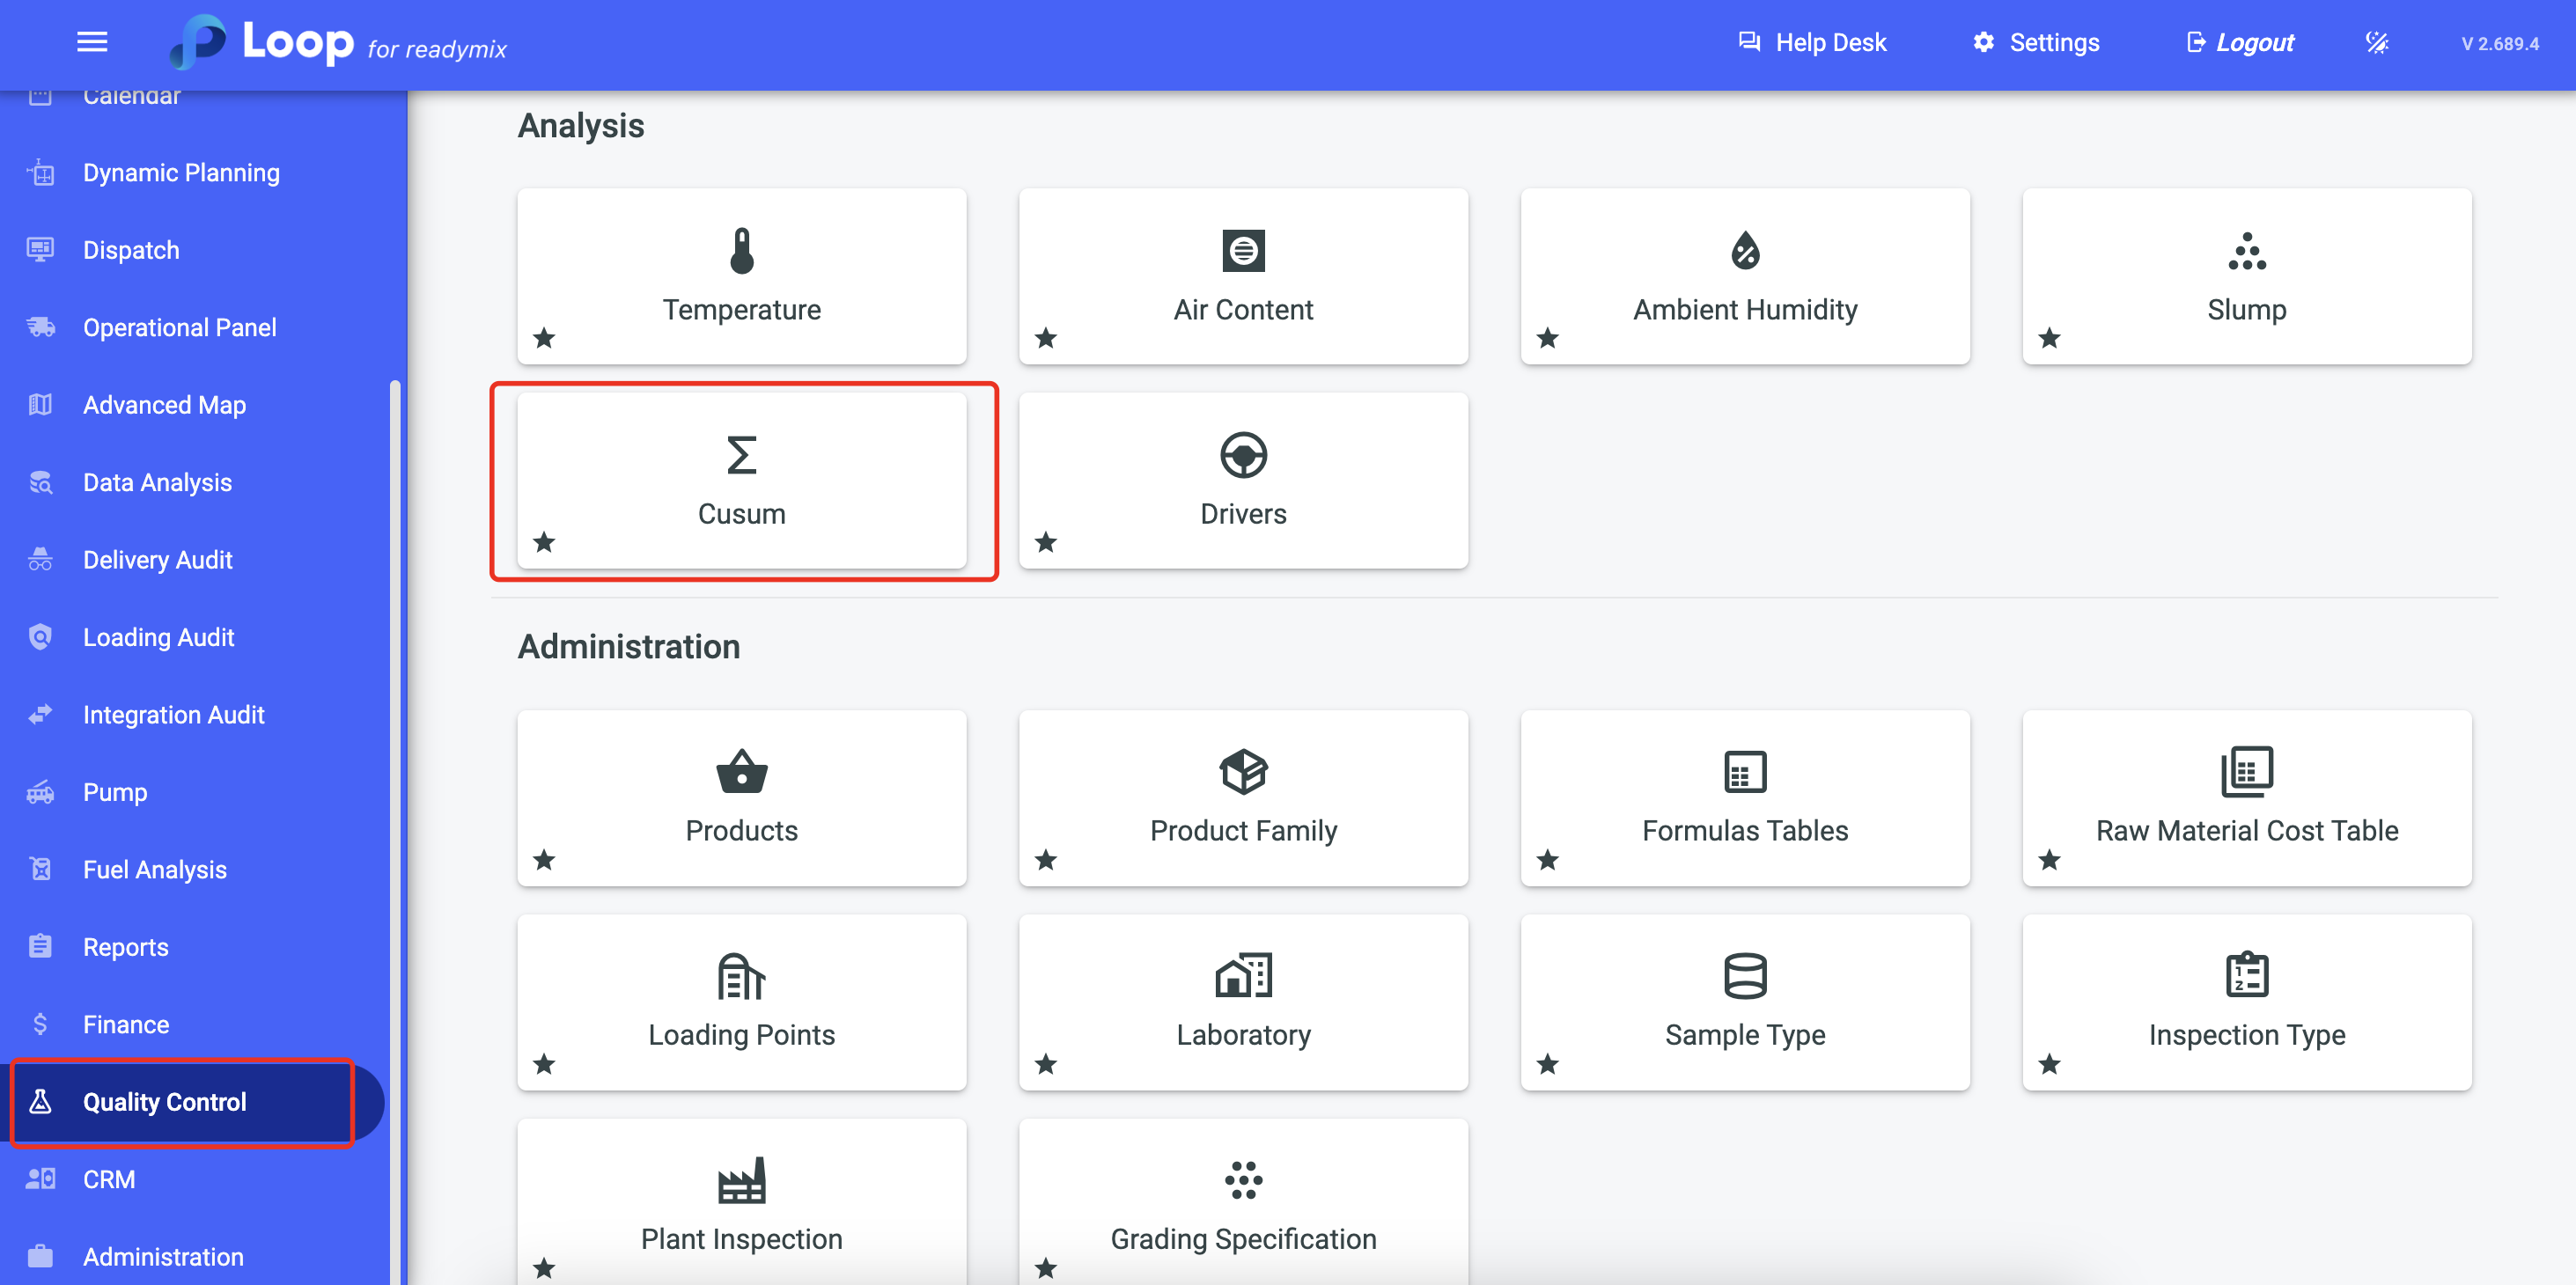
Open the menu on the left side of the screen and select "Quality Control" > "Cusum".
The mandatory filters to search for sample data are:
Disruption Period
Defines the rupture date of the disruption samples in the system.
Product FCK
Define the samples that will be used, for example, the samples in which the product theoretically has the FCK 250.
Factor for FCK 28 days expected
Factor used to calculate the FCK measured at 7 days in order to predict the FCK expected at 28 days.
Factor for MTE
Factor to calculate the Objective Average Resistance.
Target Range Cusum M
Cusum M Objective Range, that is, it is the acceptable range for the analyzes.
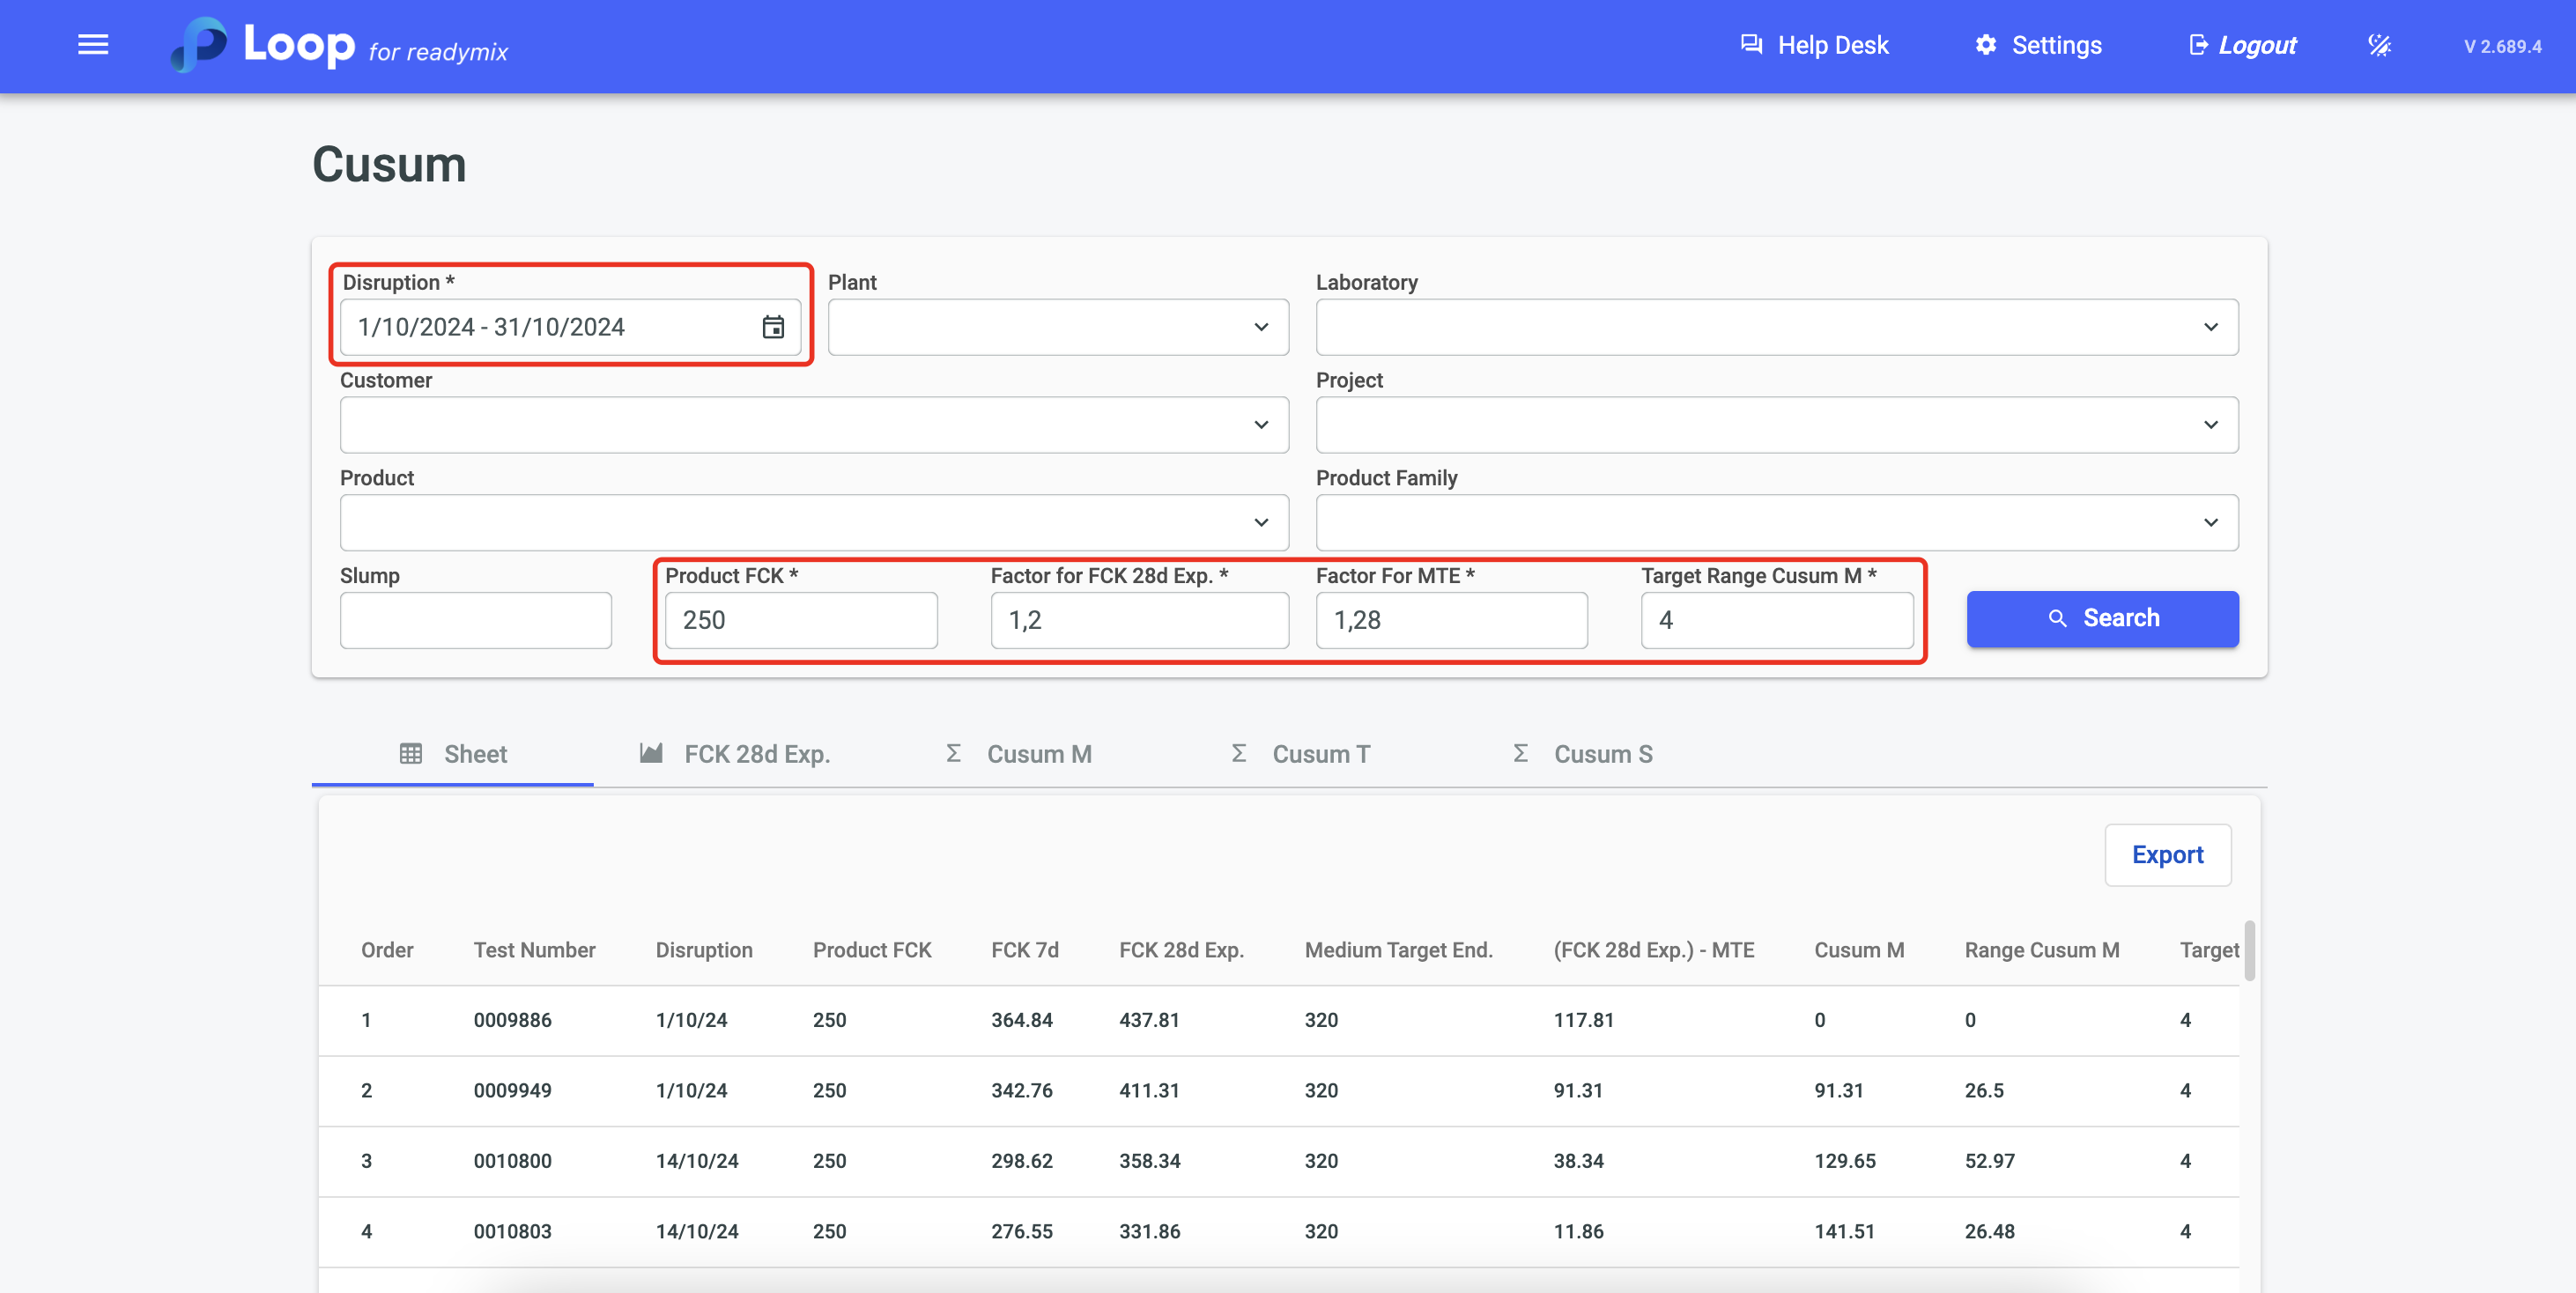
After setting the filters for the analysis, just click on "Search" and we will have all the sample data in each tab.
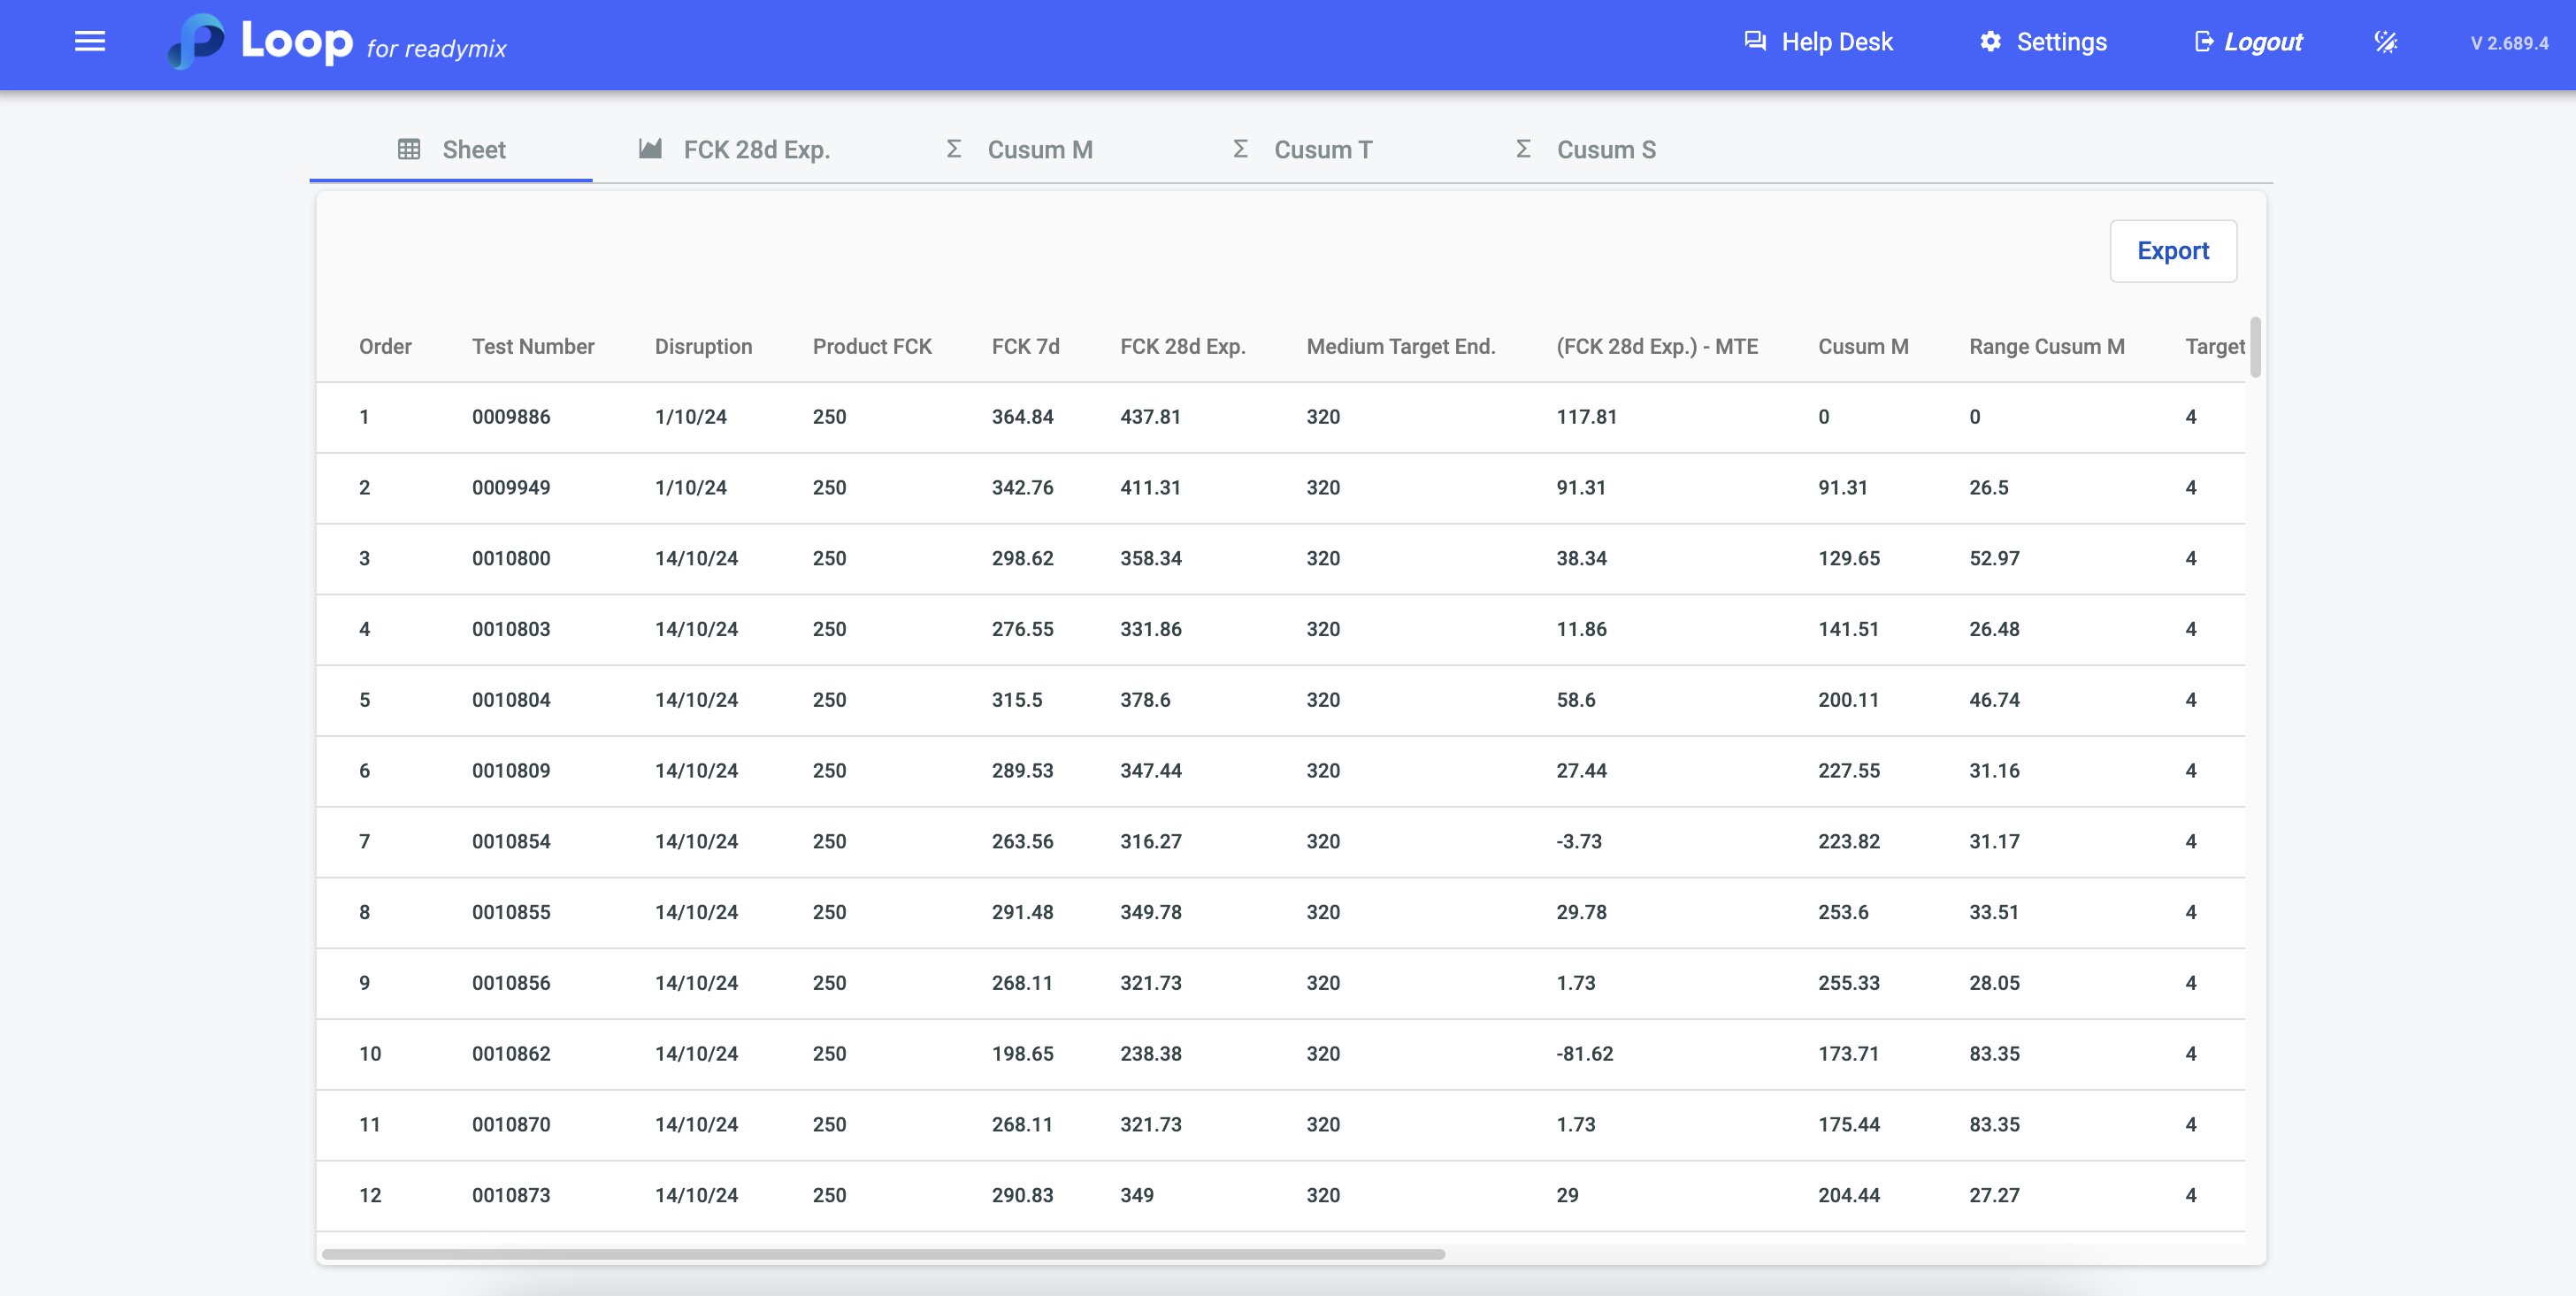
In this section, we will have the data in the "Spreadsheet" format, where each column represents a value for analysis.
It is also possible to export the data by clicking on the "Export" button.
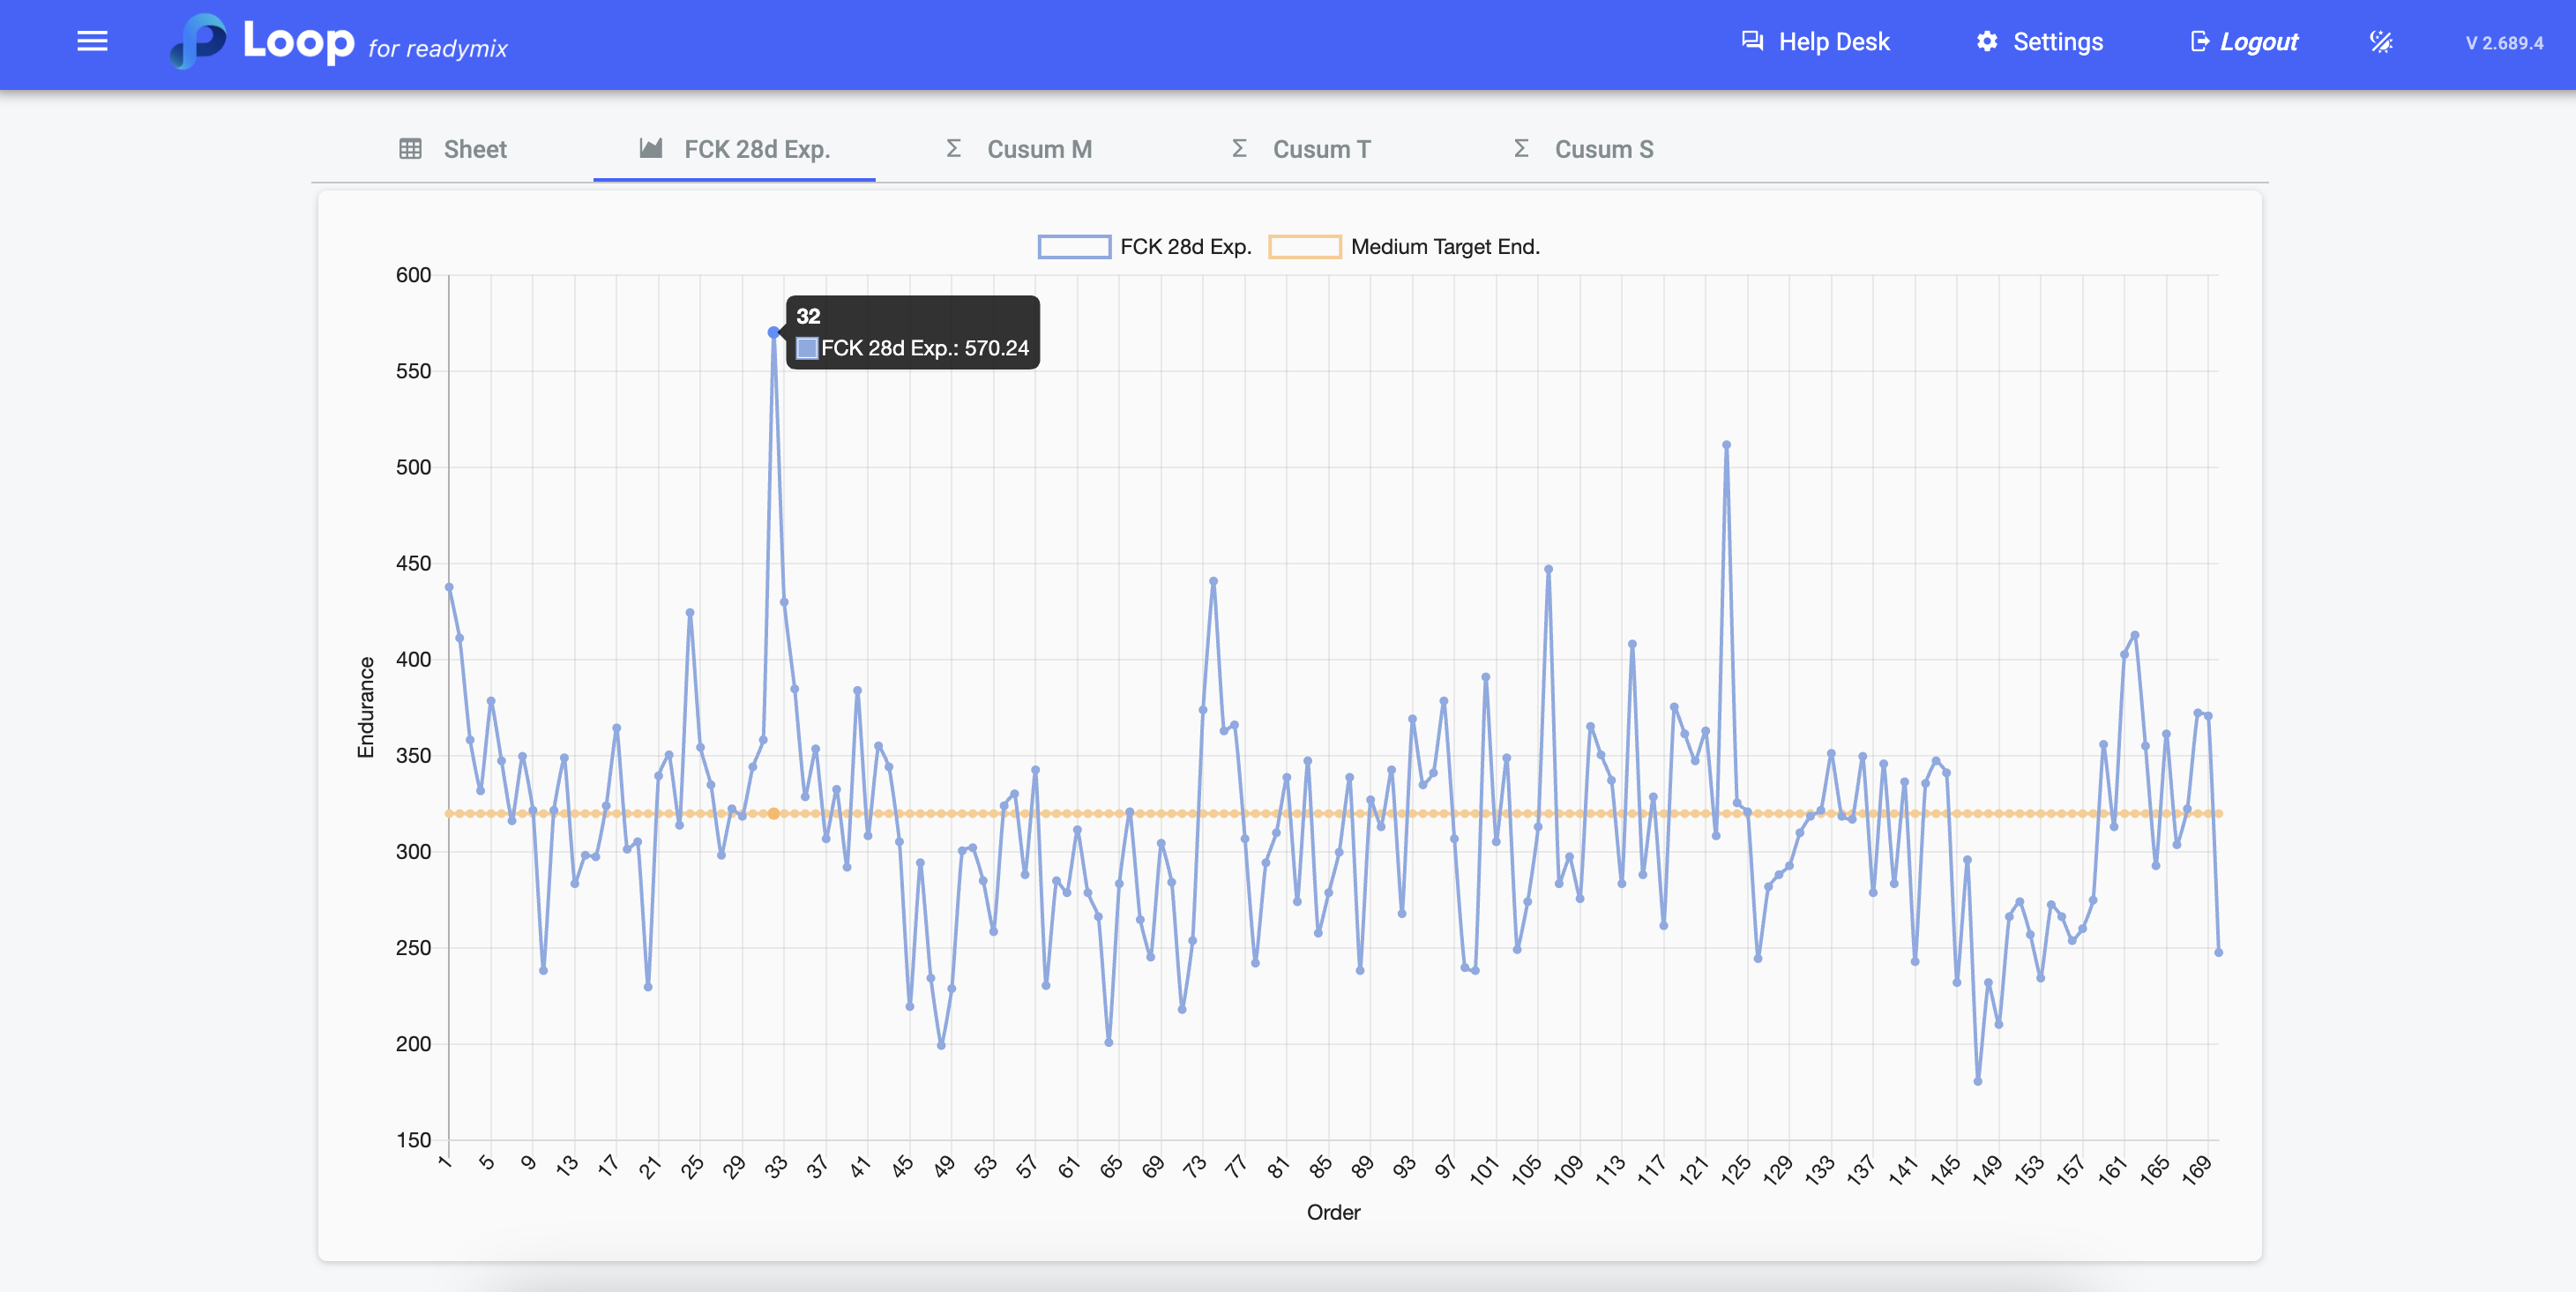
In this section, a graph will be shown that analyzes the projected resistance of the samples at 28 days, based on the results obtained after 7 days of testing.
The blue lines represent the Expected Resistance after 28 days.
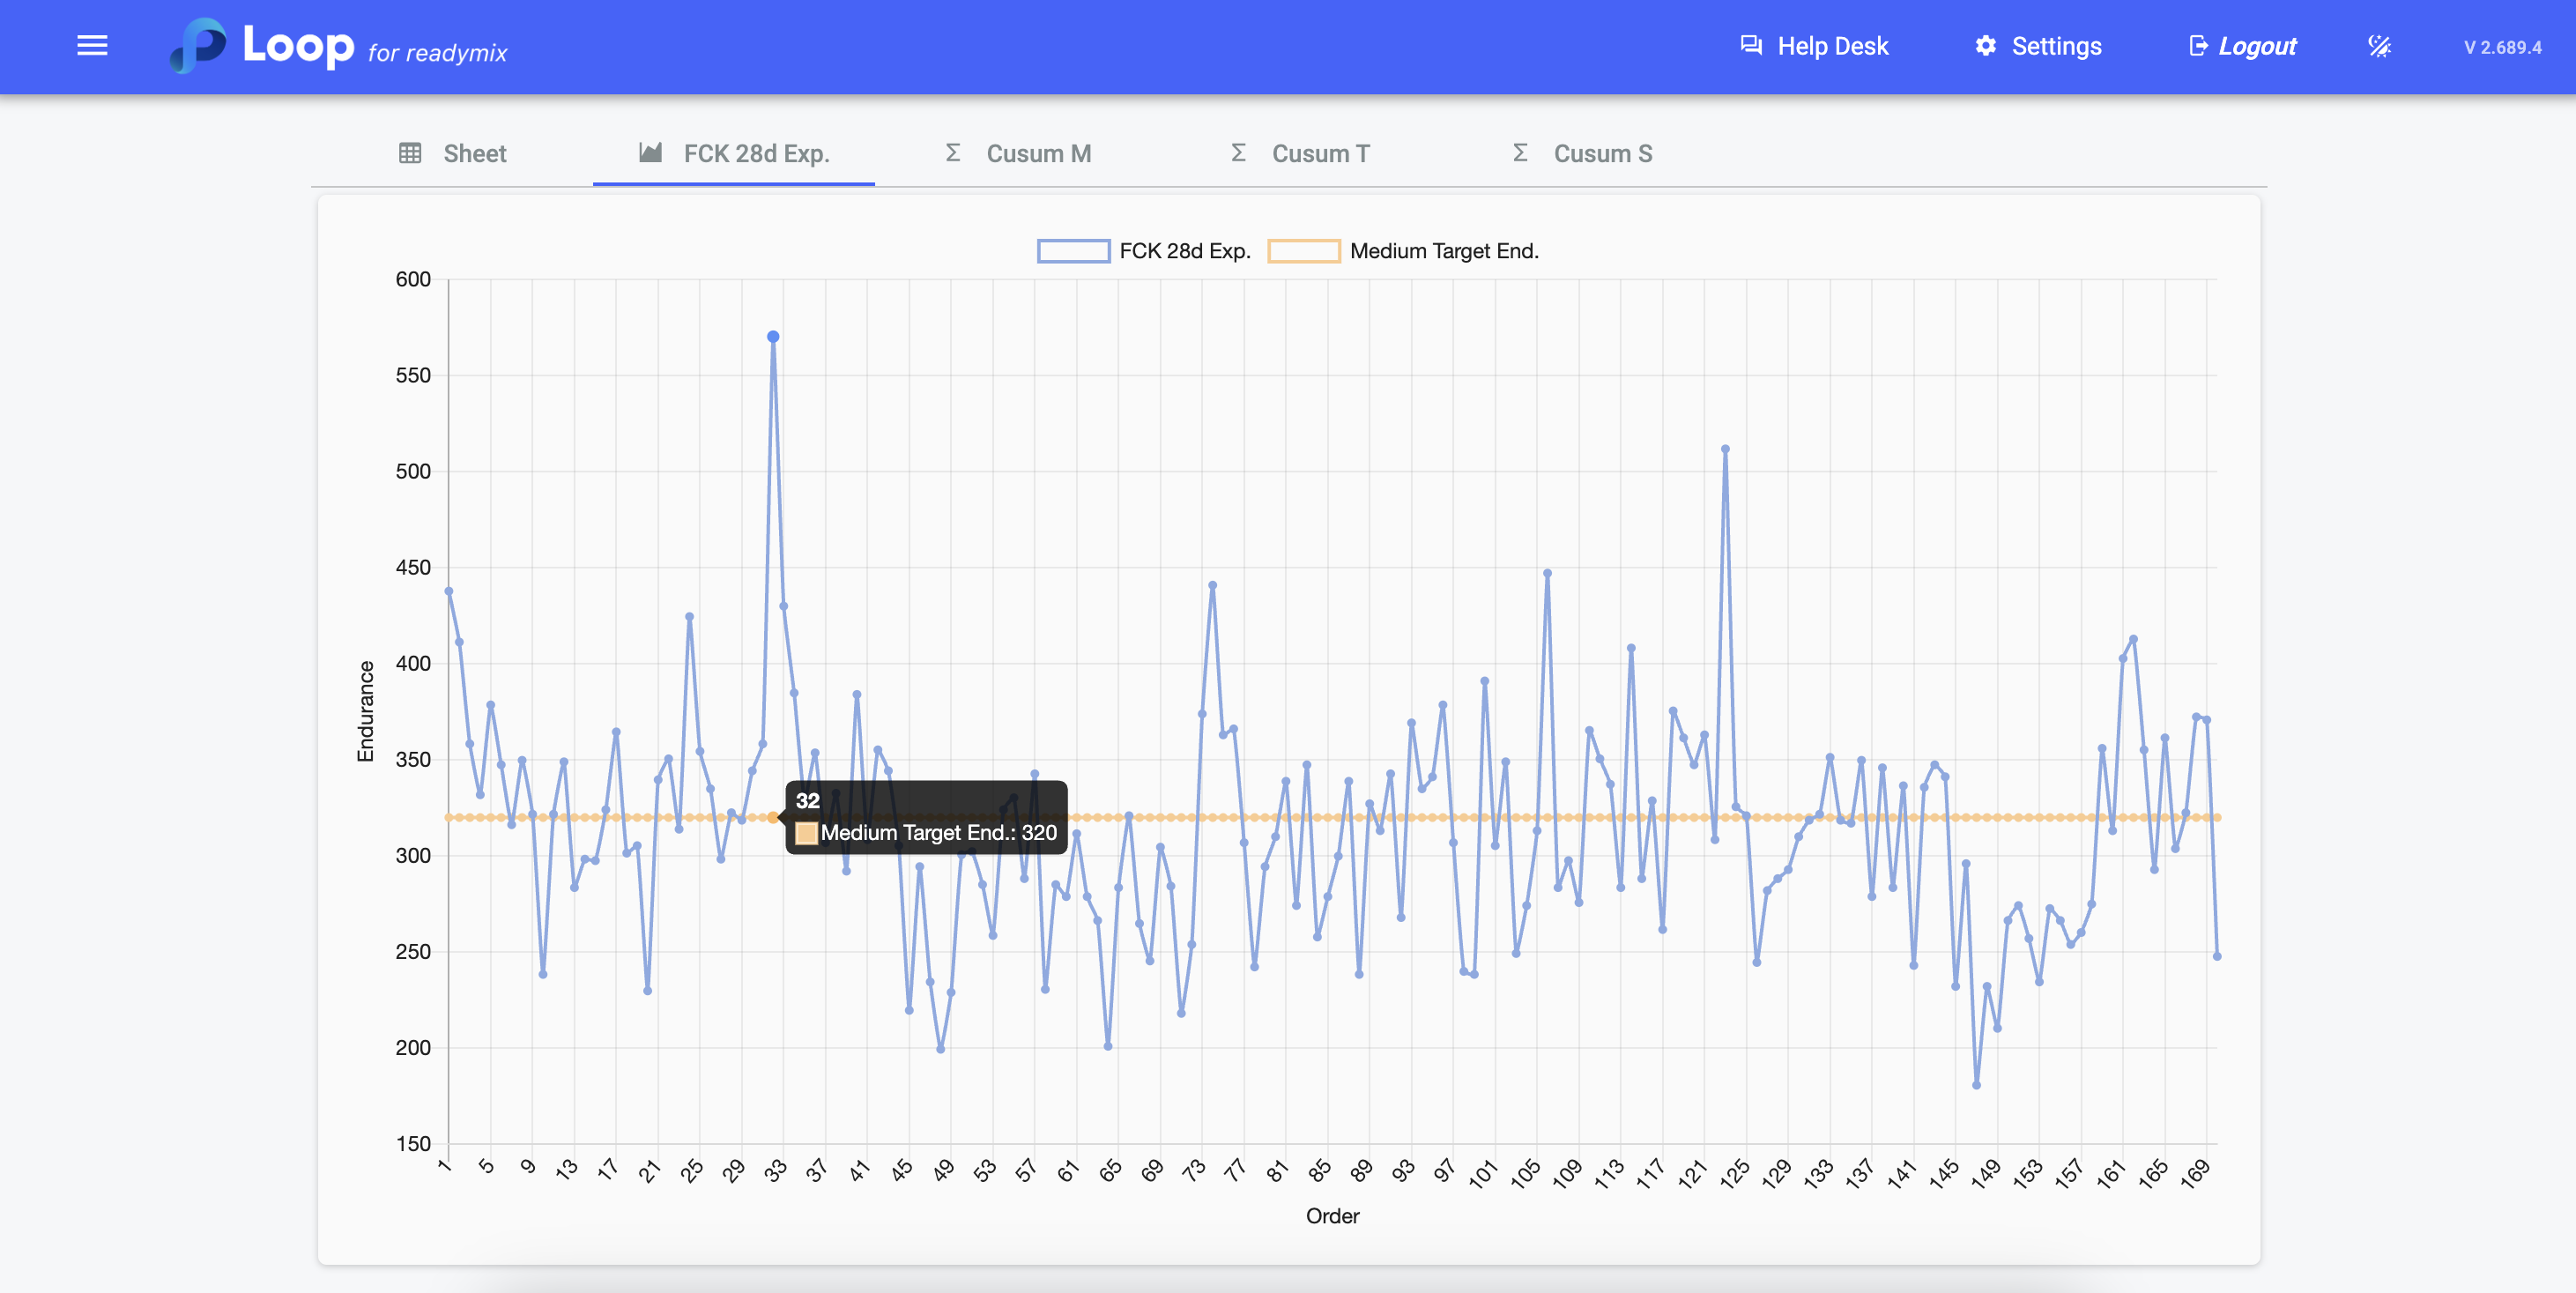
The orange lines represent the Objective Average Resistance that is calculated as follows:
In this example, 250 (FCK Value) * 1.28 (MTE Factor) will be calculated, totaling 320.
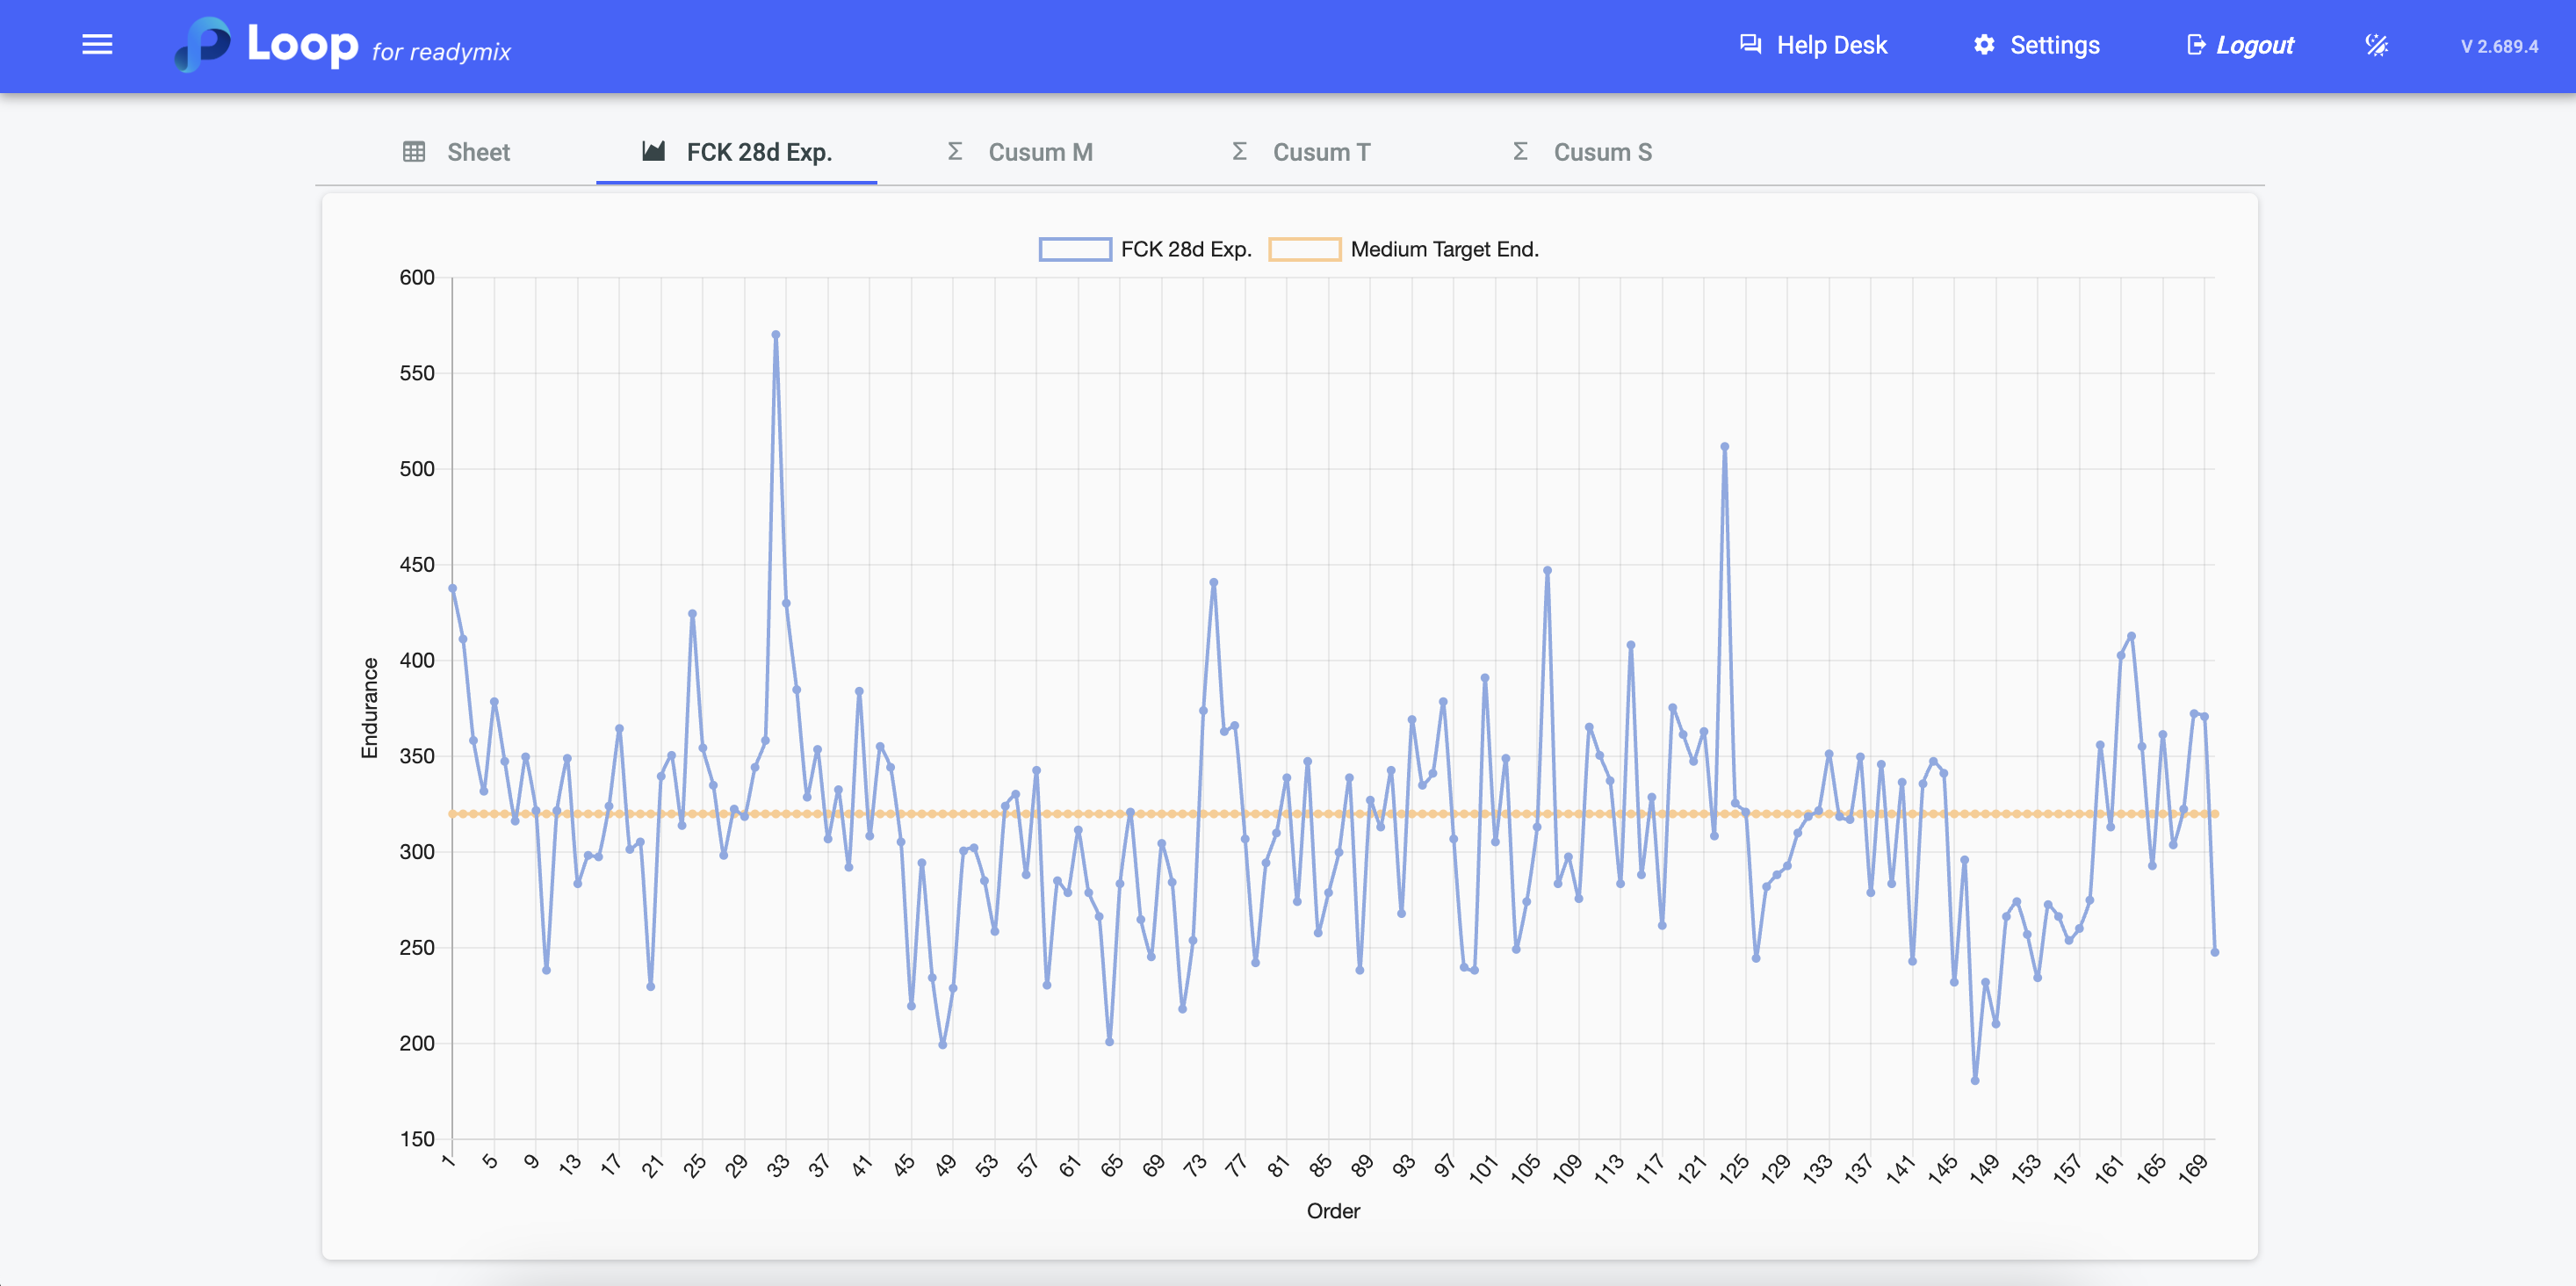
By hovering the mouse over the blue line, it will be possible to view the expected resistance value after 28 days.
And by hovering the mouse over the orange line, it will be possible to view the value of the Average Objective Resistance.
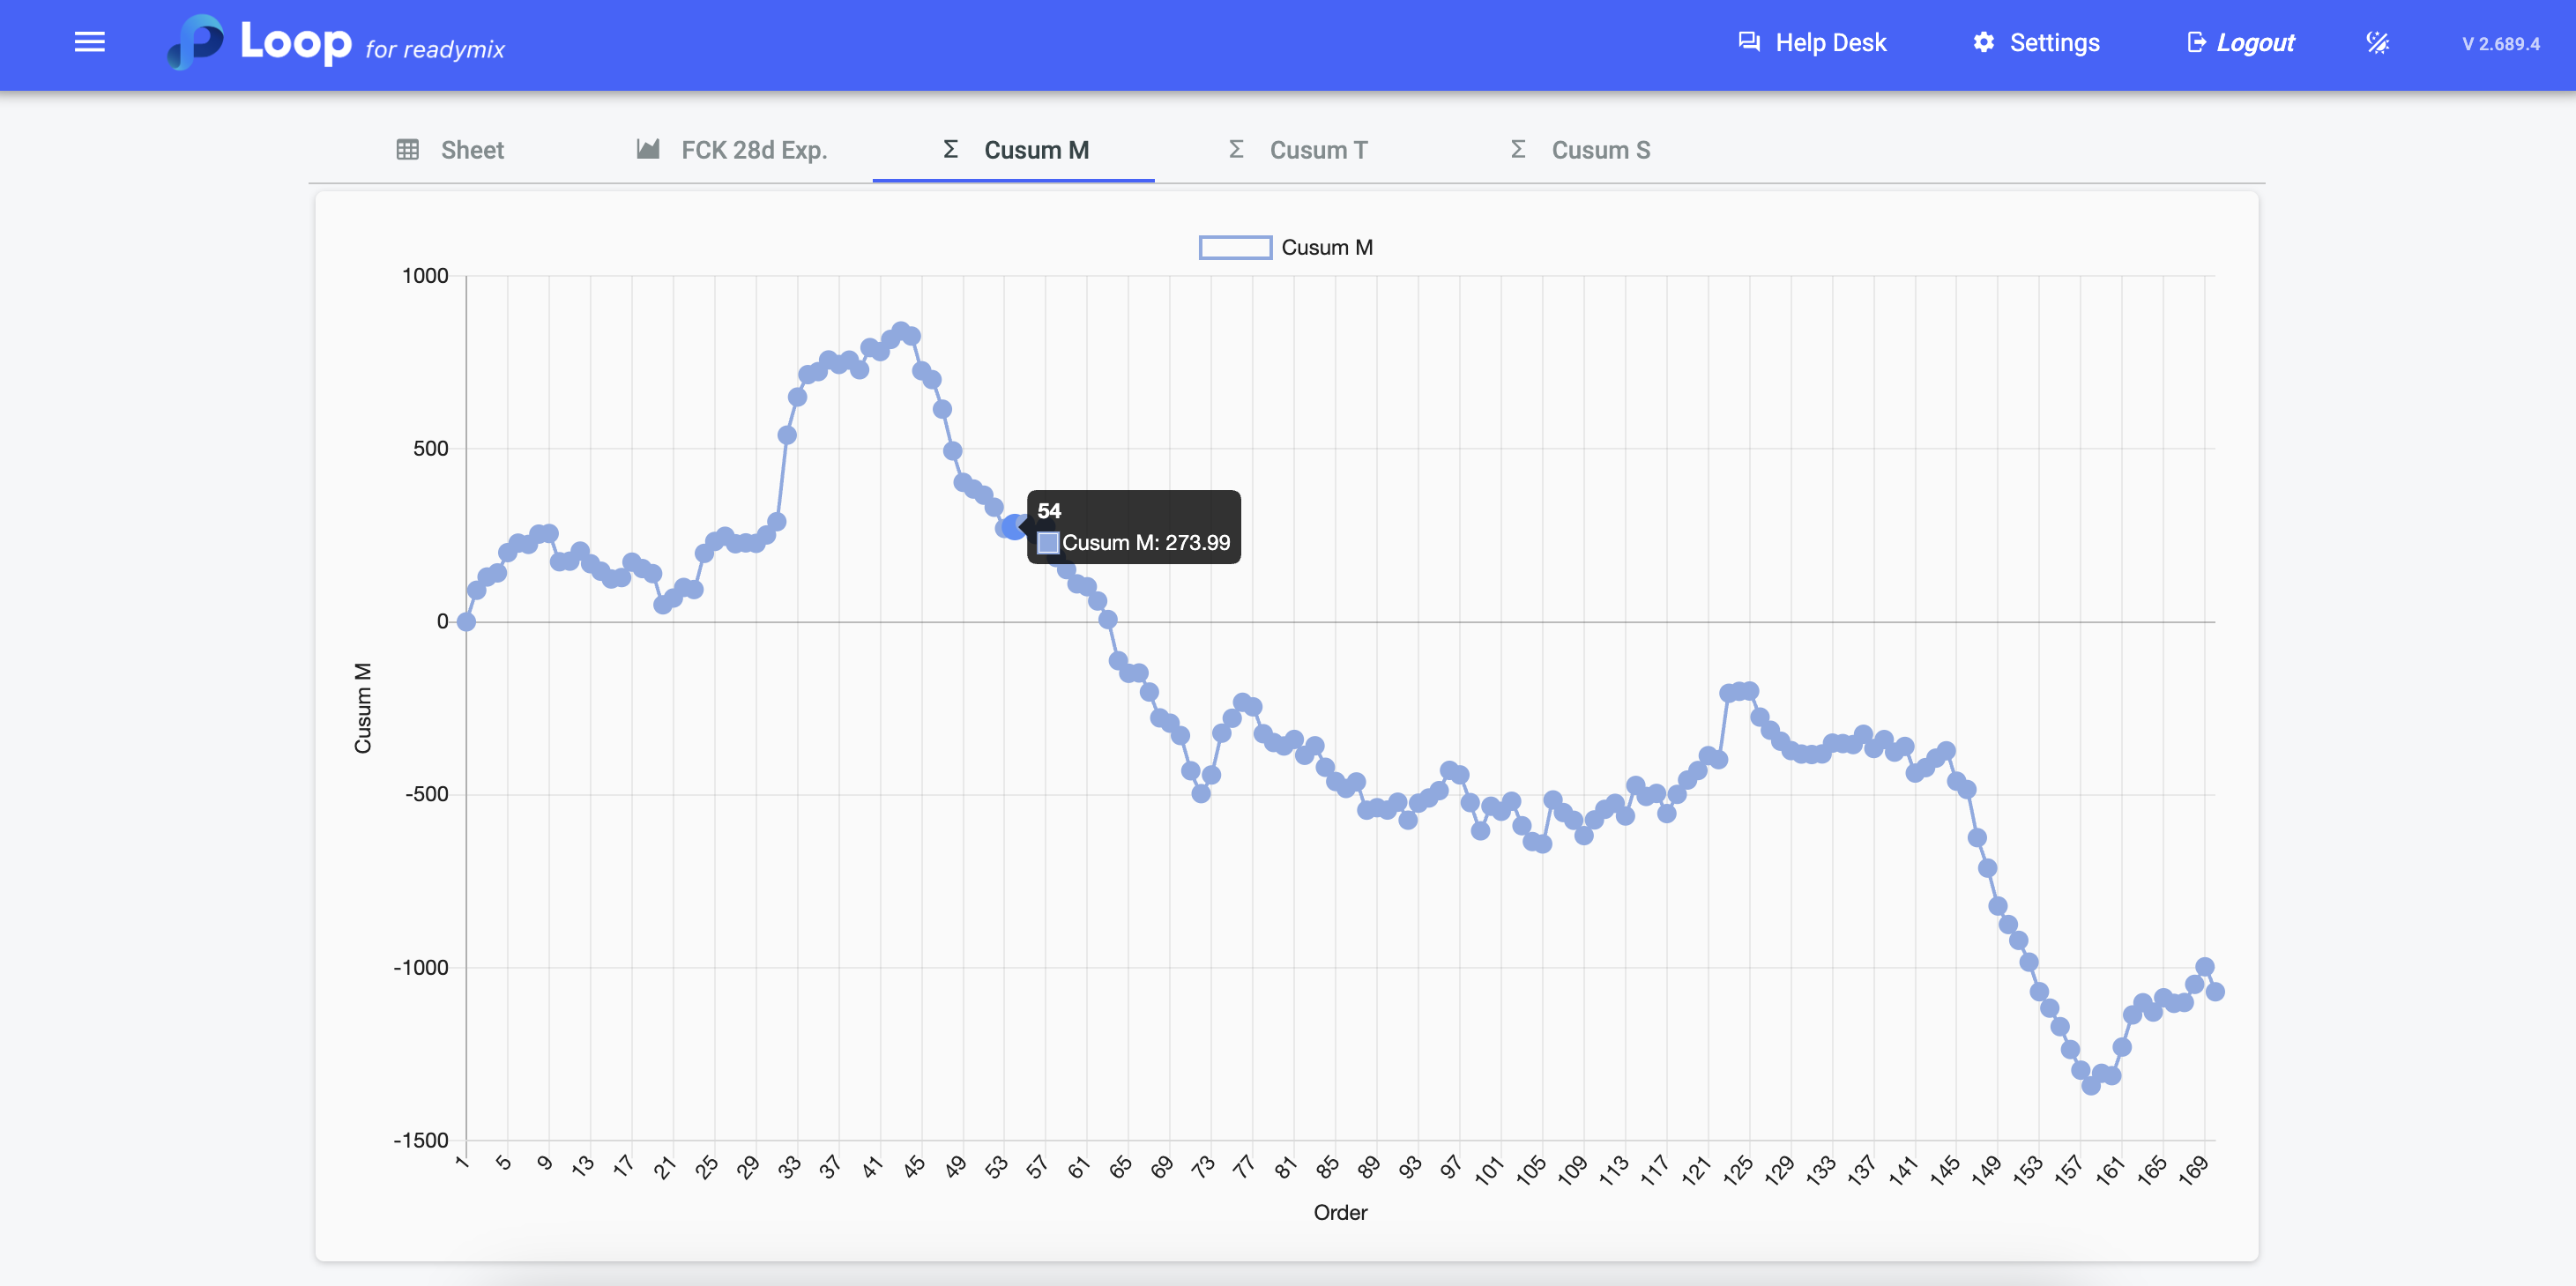
In this section, a graph representing Cusum M, also known as the Objective Cusum Range, will be shown.
Cusum M serves as an indicator that monitors the cumulative variation of concrete resistance results in relation to an established objective or reference value. This acceptable interval for analysis allows you to identify trends or deviations in concrete performance over time.
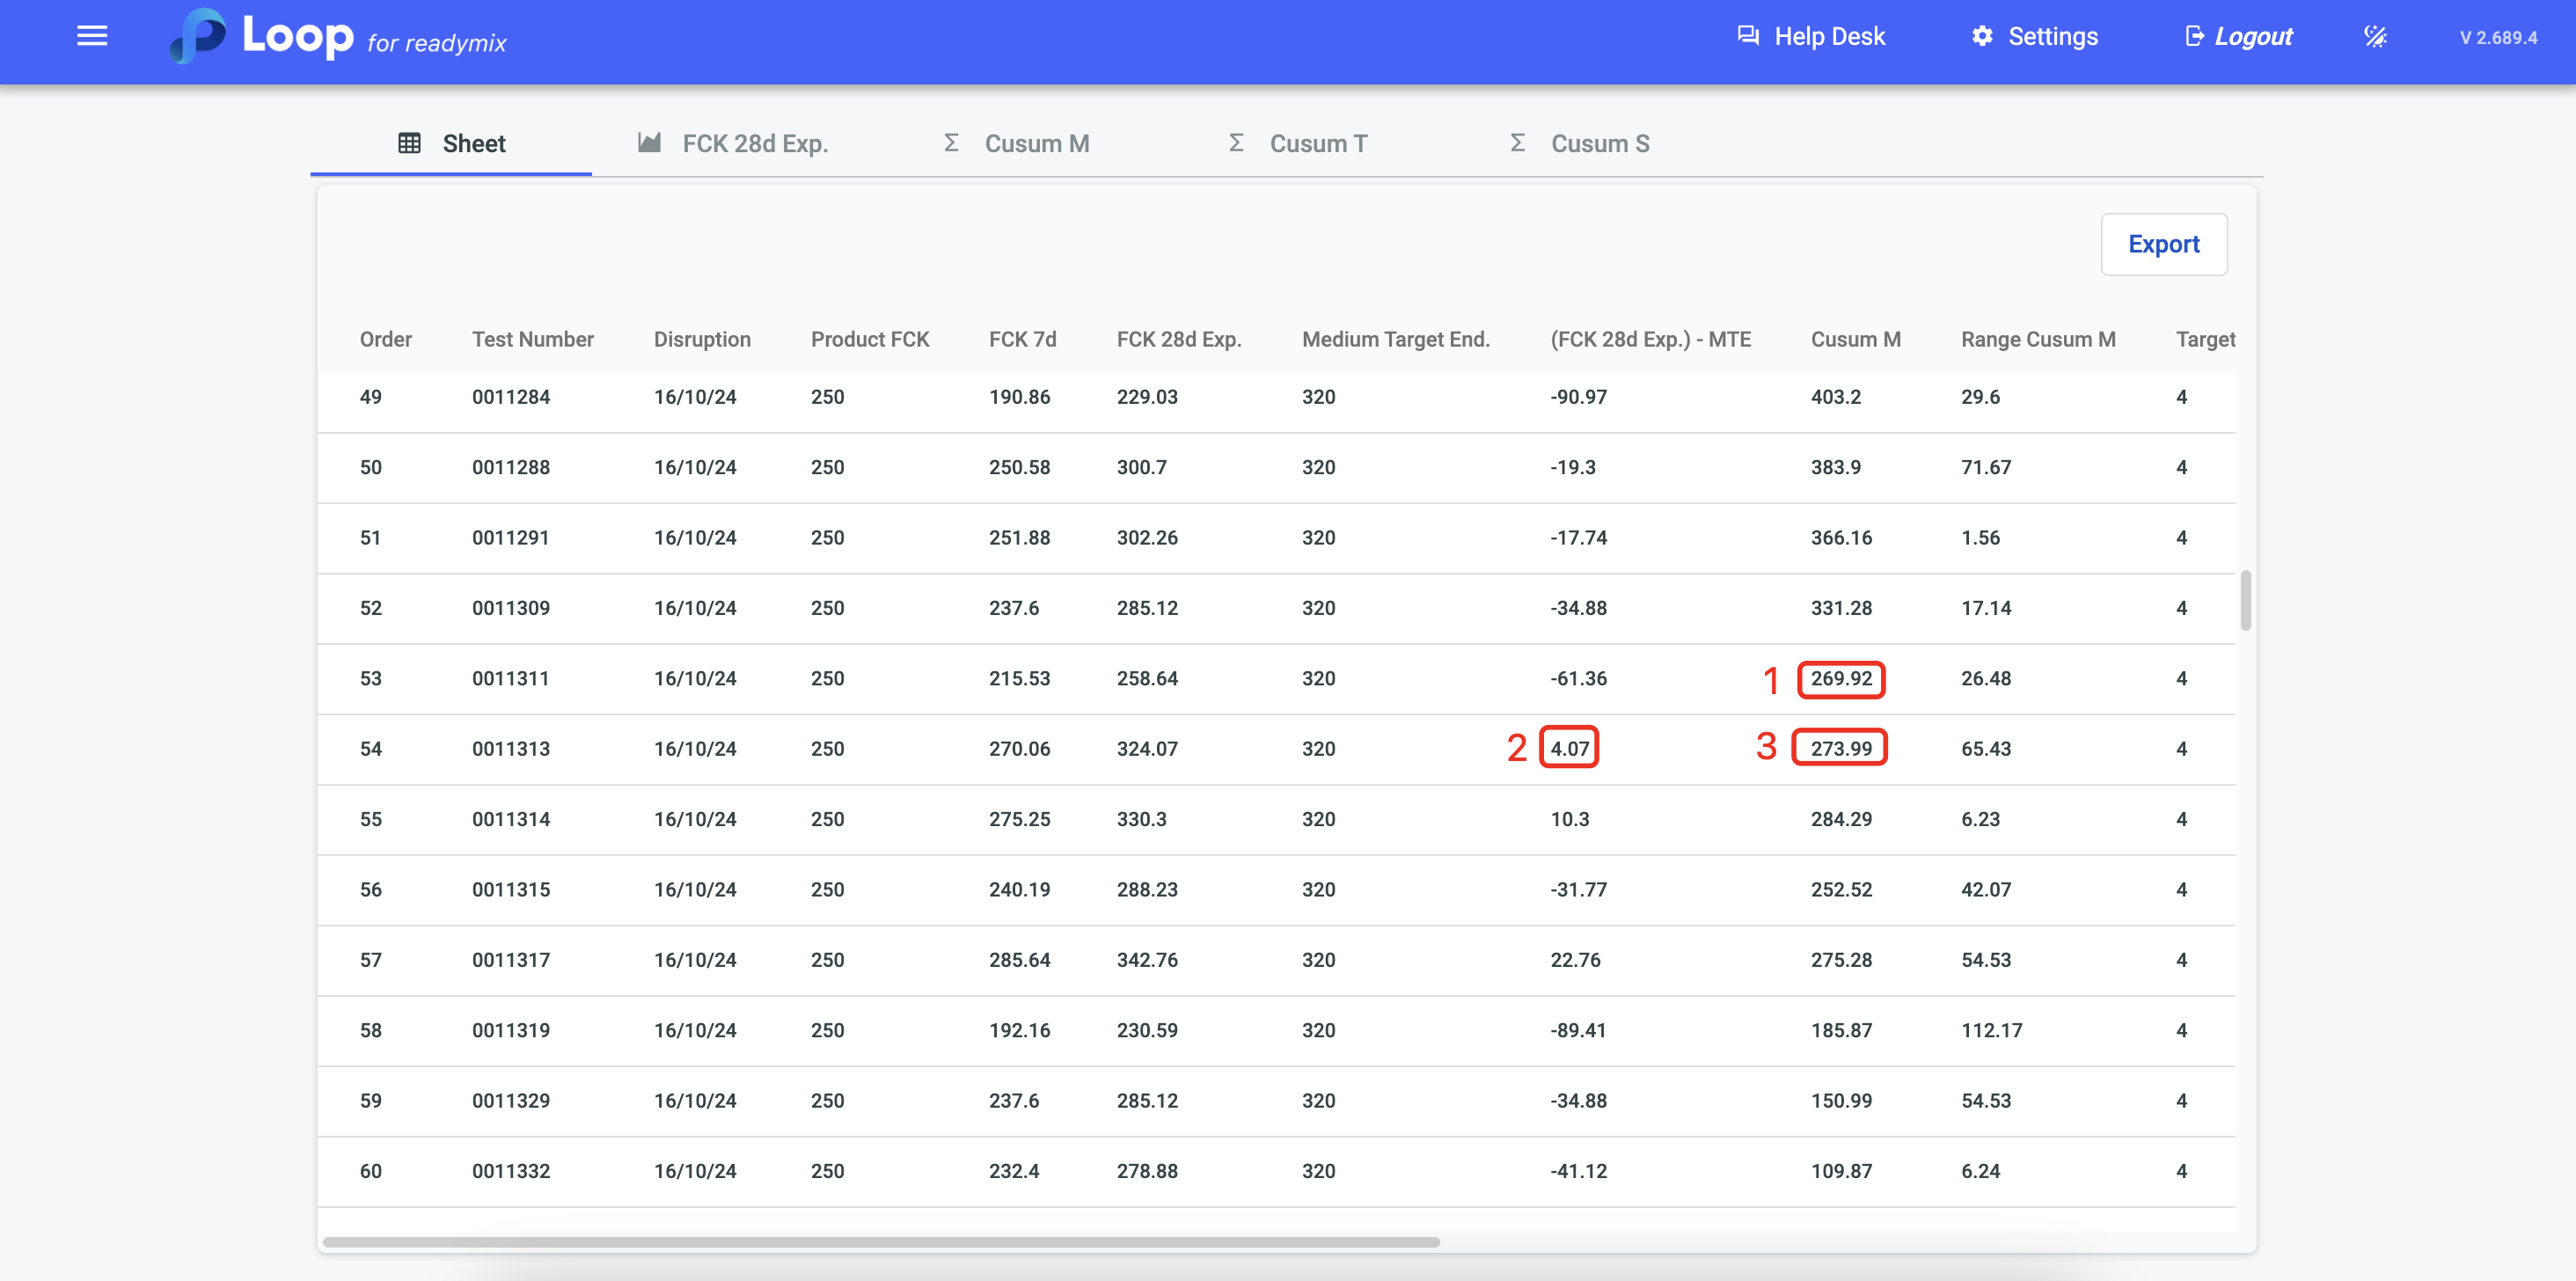
See how this calculation is done in the system: we start by checking the previous value in column "Cusum M" (1) and add to the current value obtained in column "(FCK 28d Esp.) - RMO" (2) and we will have the current value of "Cusum M" (3).
In this section, a graph representing the Cusum T will be displayed, which reflects the accumulated absolute differences between the values of "FCK 28 expected days" over time, adjusted by subtracting the Average Objective Cusum Time.
This indicator allows you to monitor variations and possible instabilities in concrete resistance.
How the Cusum T calculation is done:
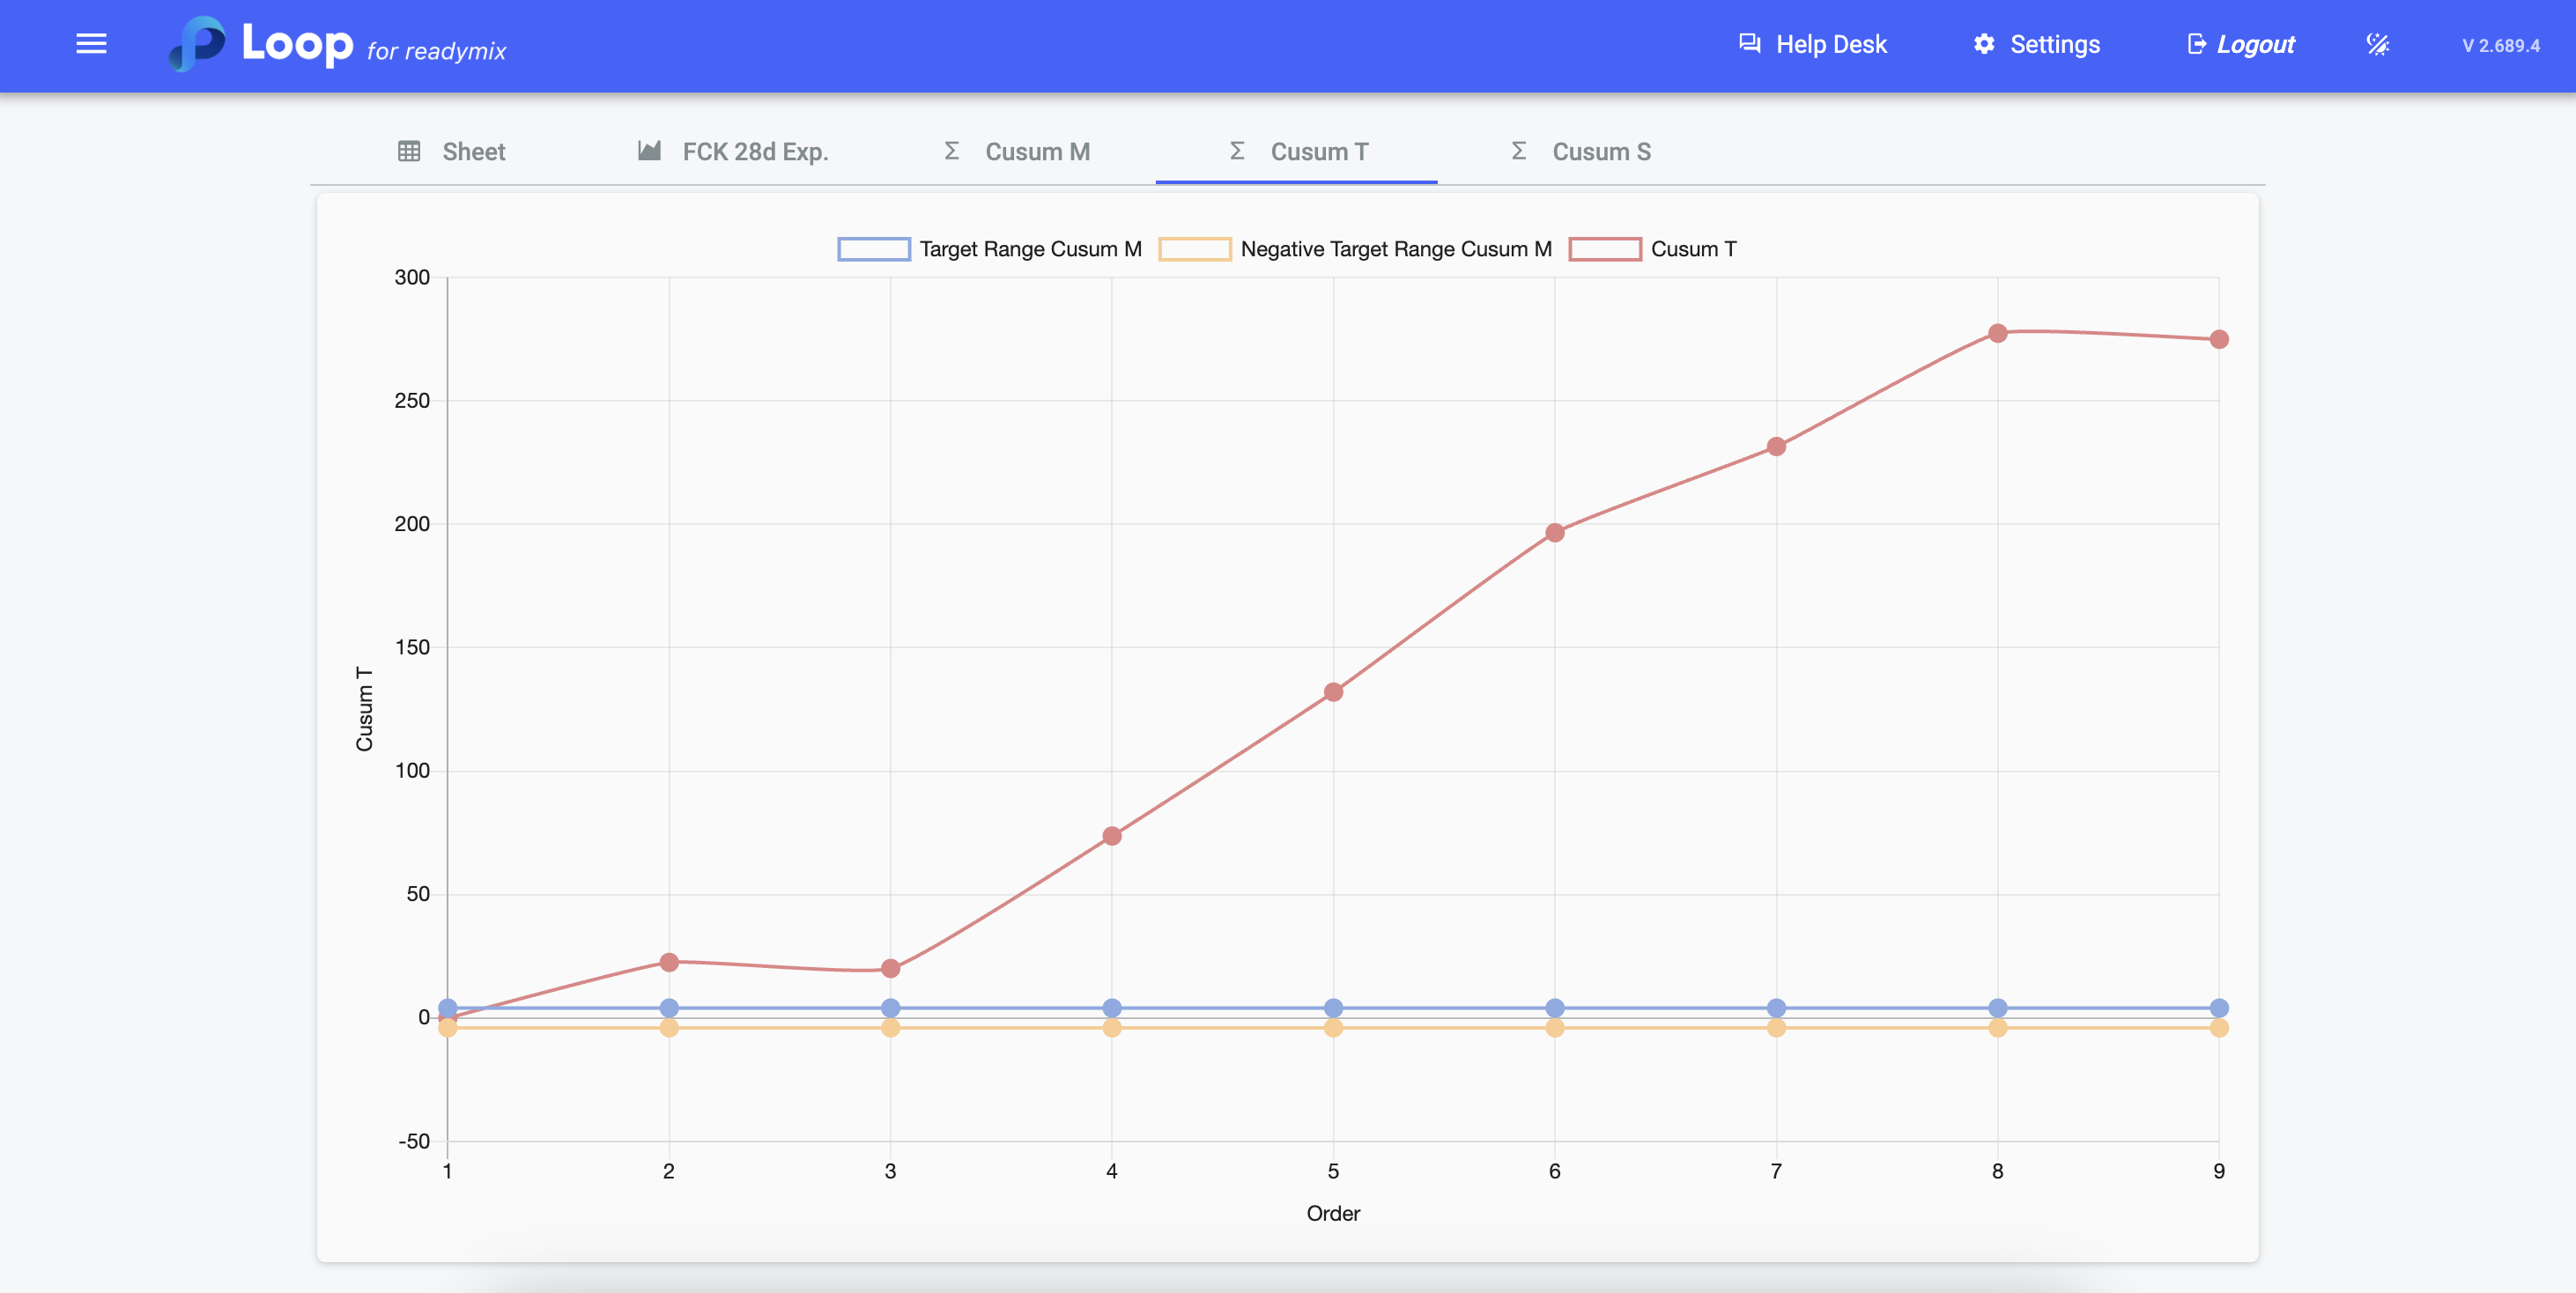
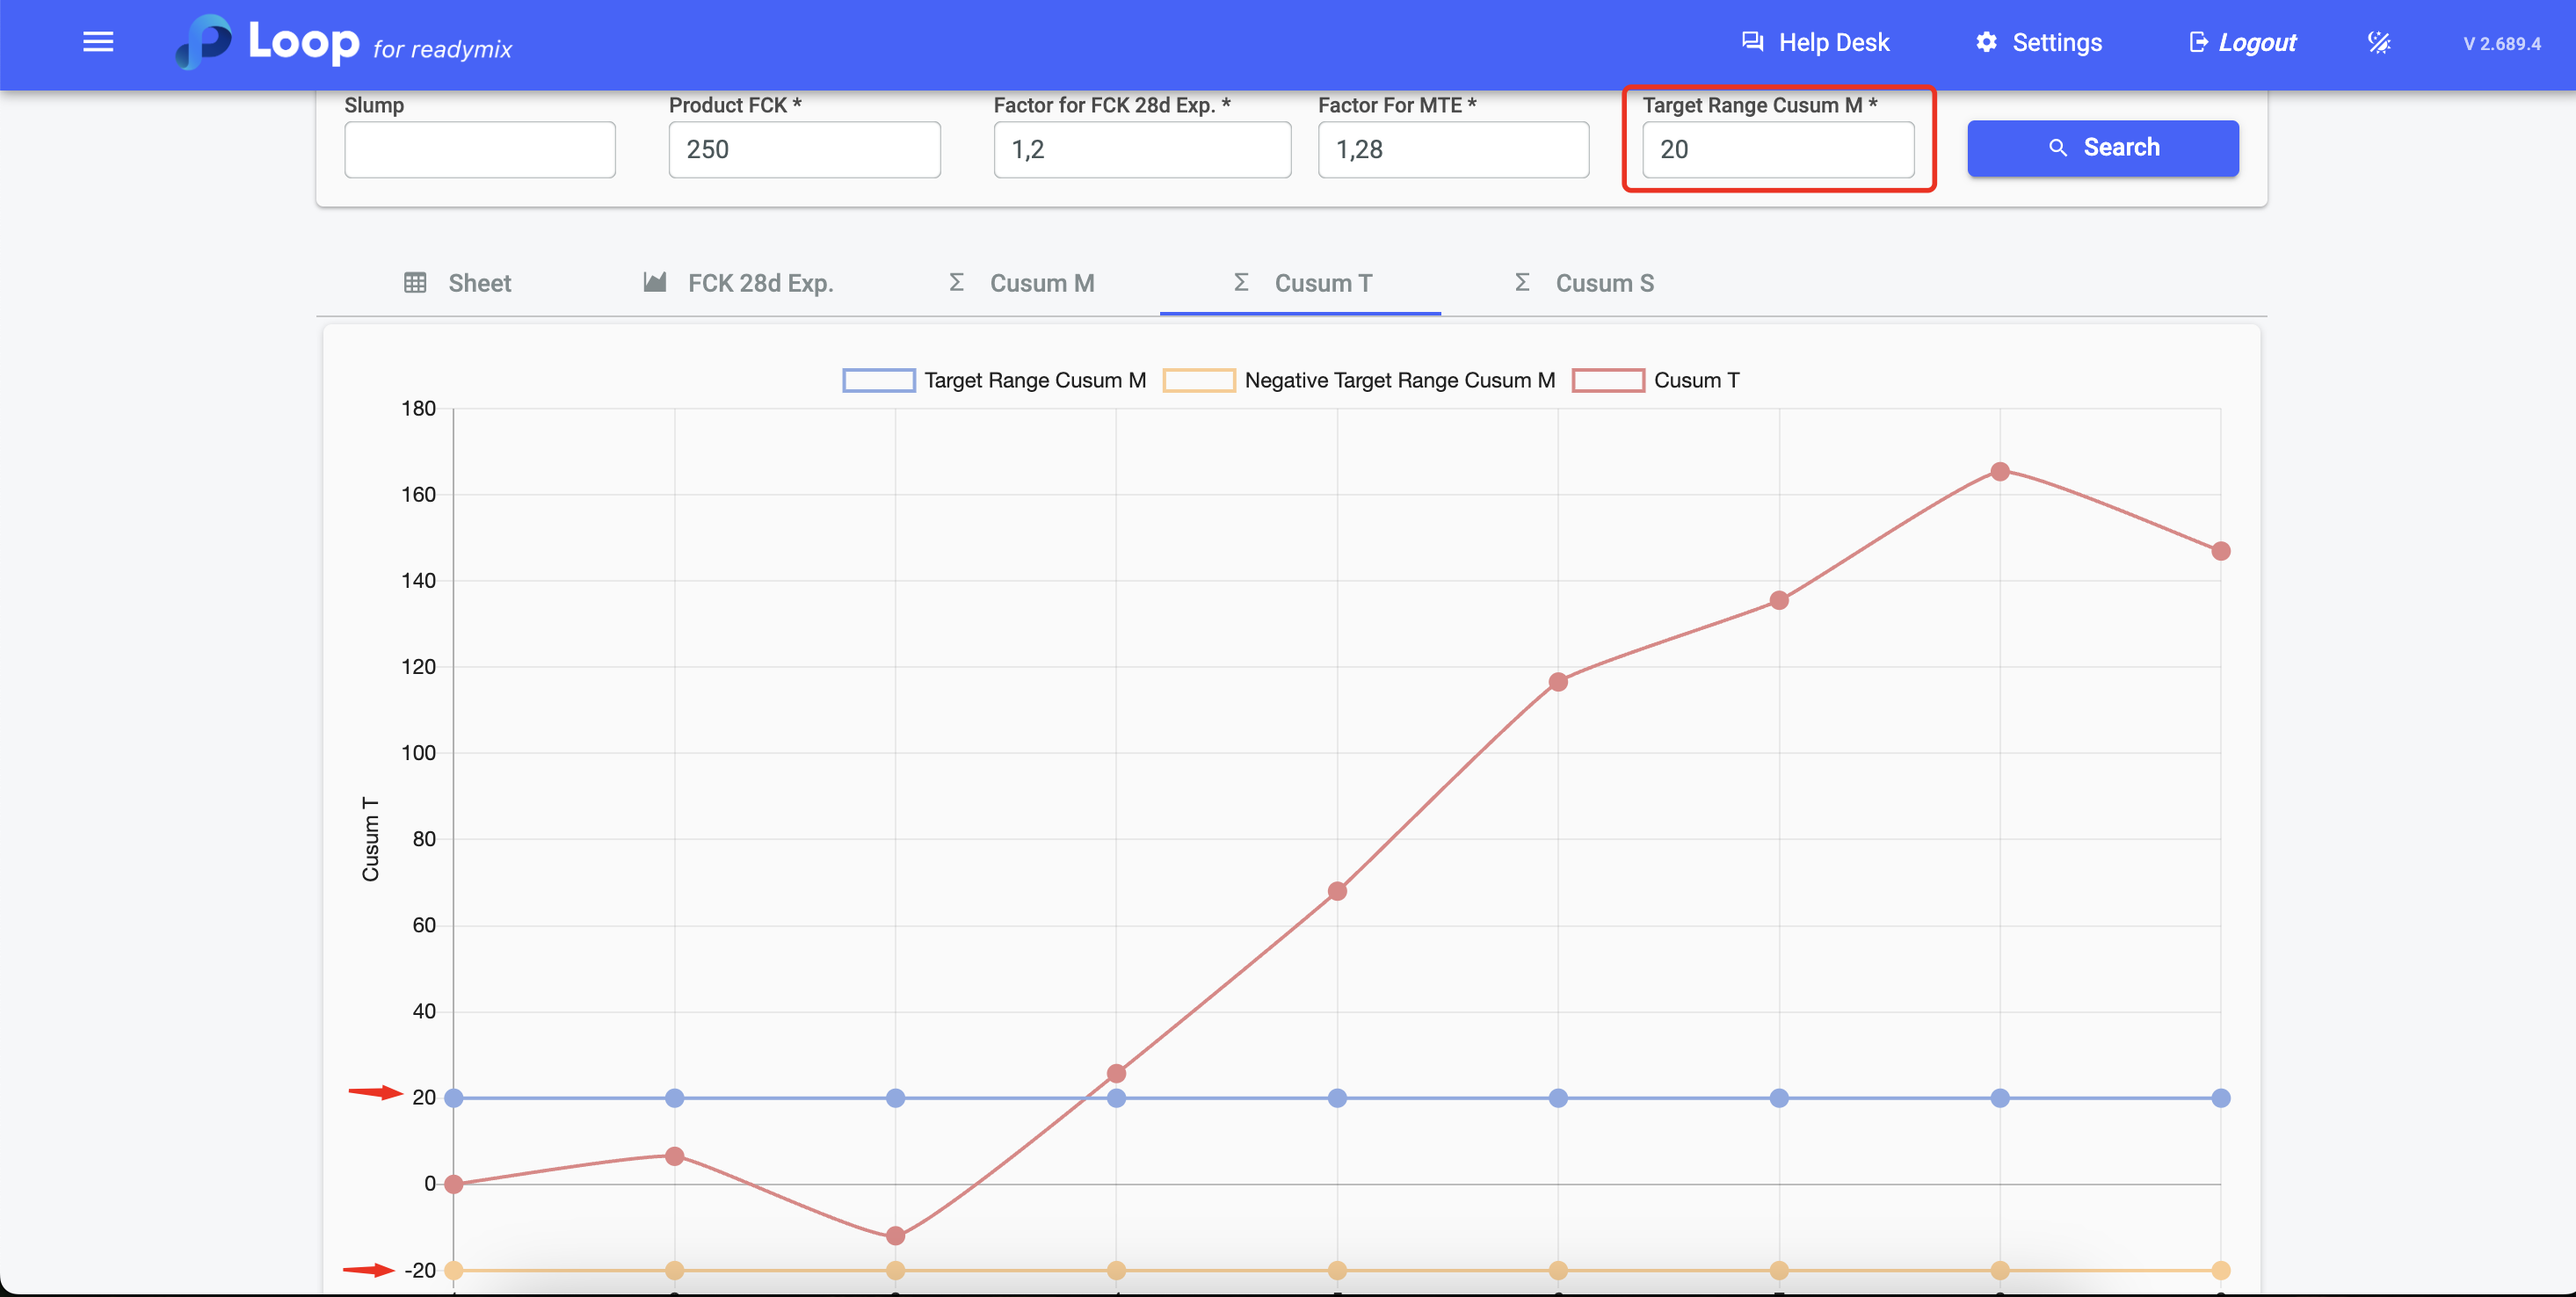
It is also possible to change the value of the Range Cusum M Obj. field and filter it again so that it is recalculated.
In this example, we added the value of the Cusum M Obj. Range to 20 and the graph performed the calculations again.
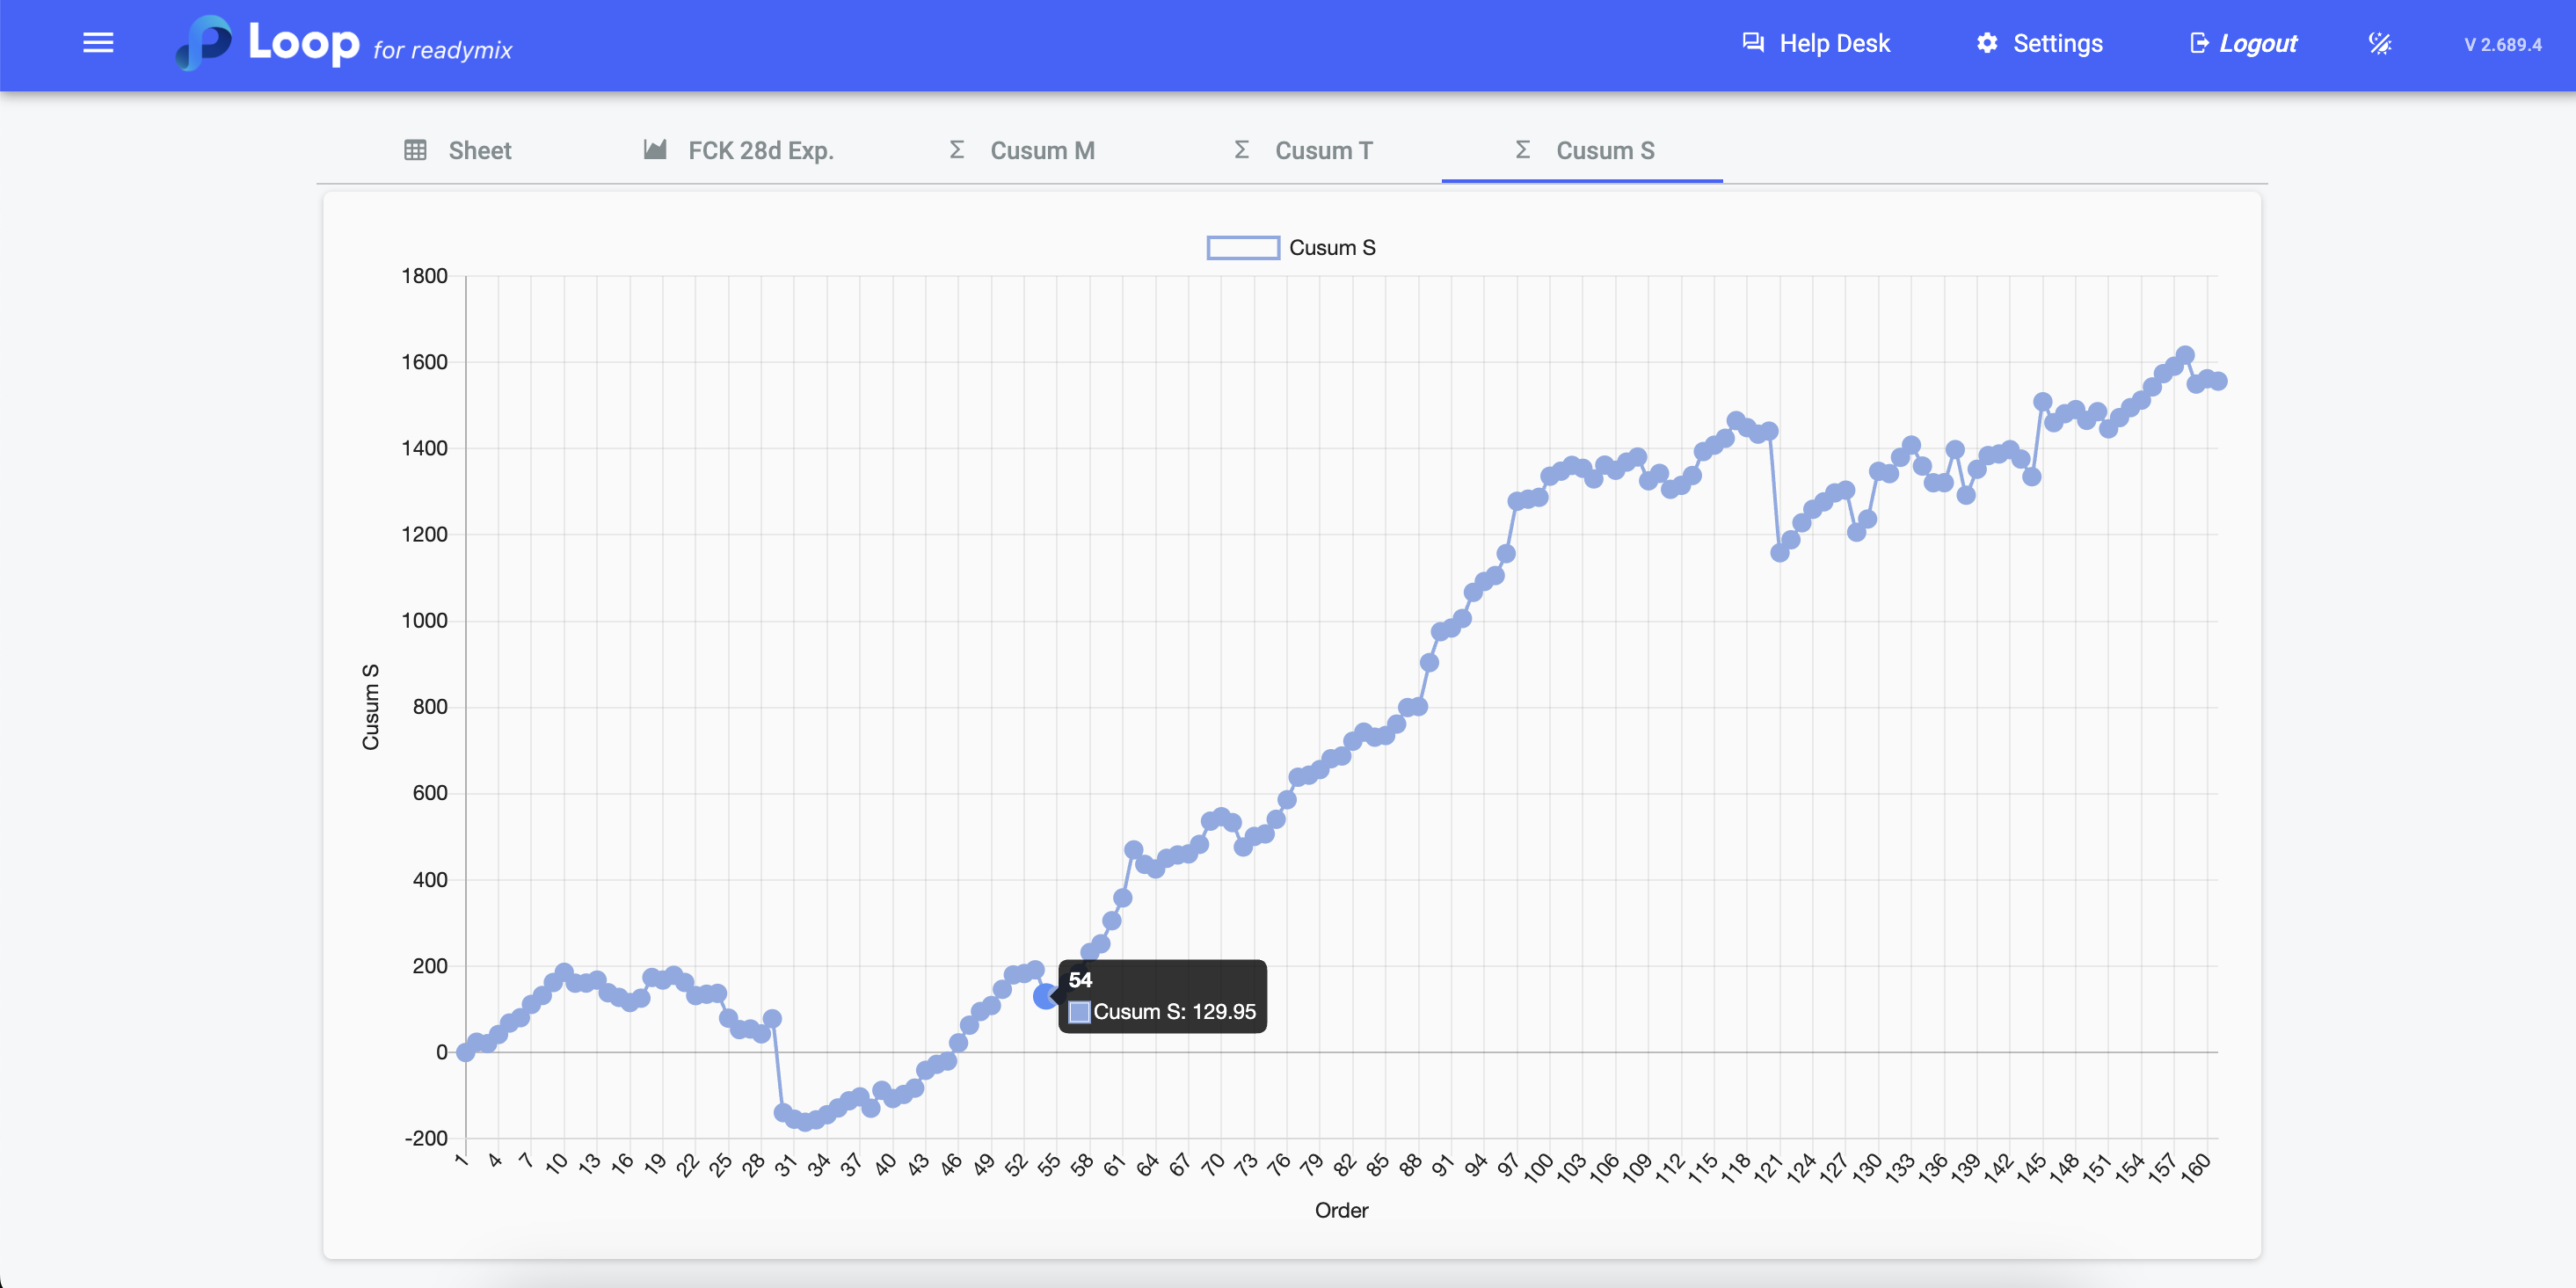
In this section, a graph representing Cusum S will be shown, which is the cumulative difference between the "FCK 28 Real" and the "FCK 28 days expected". This indicator evaluates the actual performance of concrete in relation to the projected expectation of resistance at 28 days, accumulating deviations over time.
How the Cusum S calculation is done:
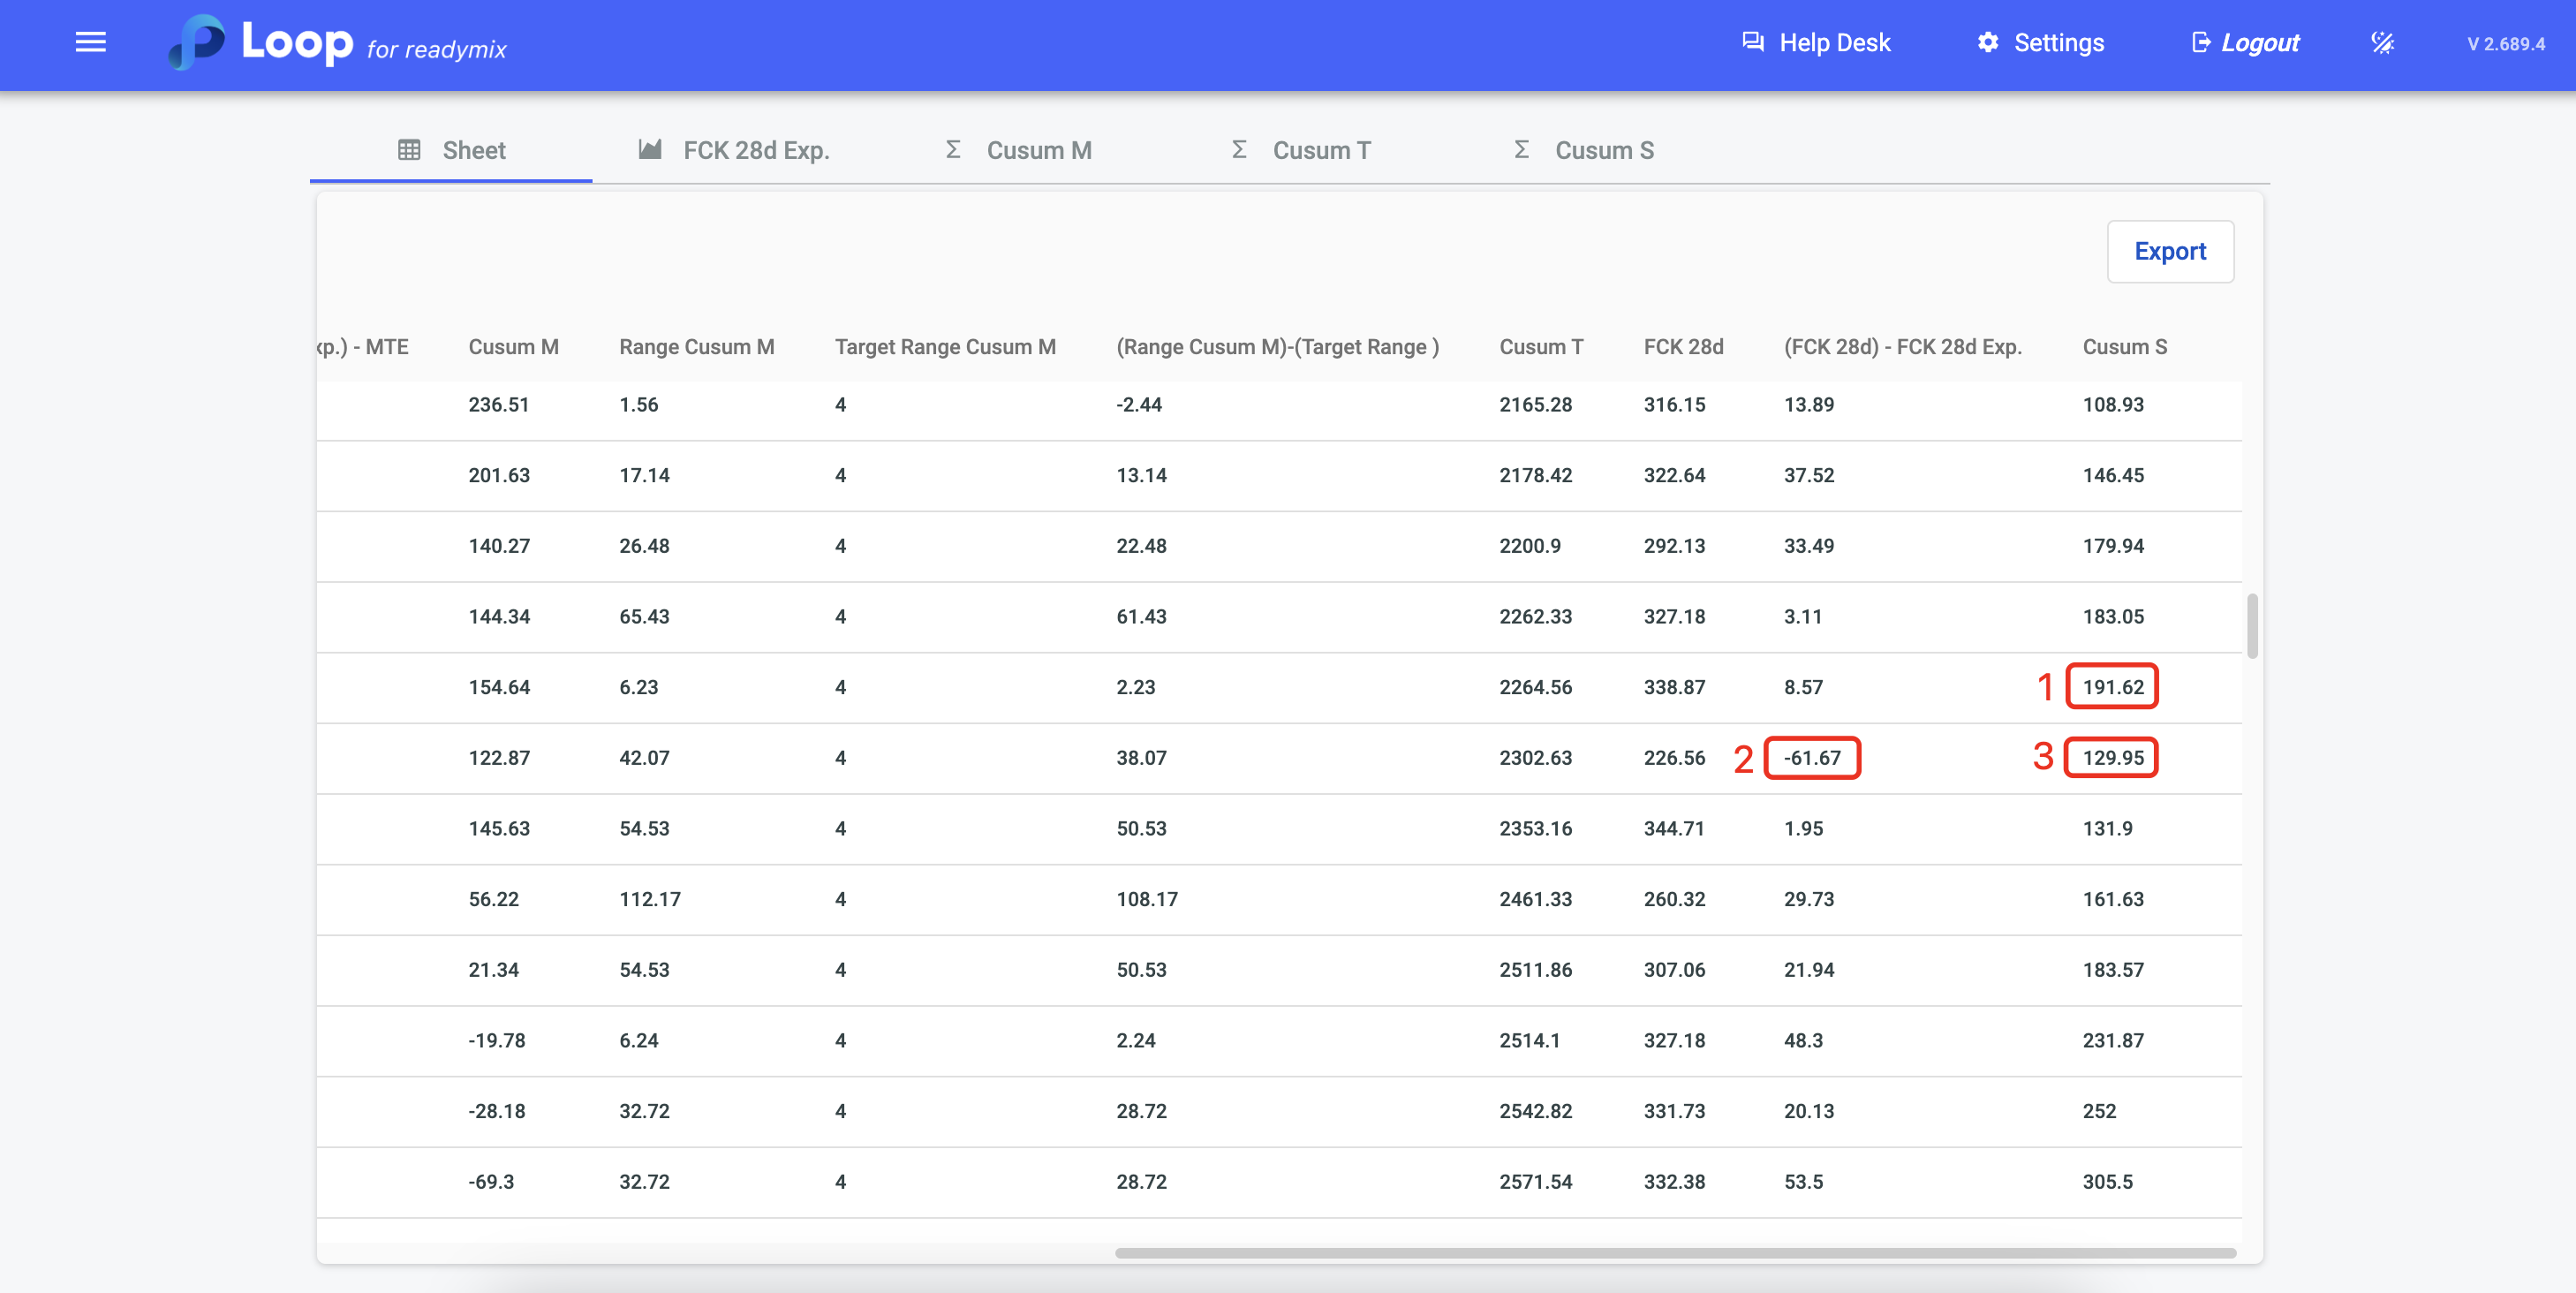
See how this calculation is performed in the system: we start by checking the previous value in the column "Cusum S" (1) and subtract the current value obtained in the column "(FCK 28d) - FCK 28d Esp." (2) and we will have the current value of the "Cusum S" (3).
Note: All graphs are generated based on the values adopted by the company to perform the analyzes.